- Please choose a product to add to your cart…


$35.00
A valuable book which covers both the “art” and the substance of contouring: hand and computer methods, estimation techniques, checking results, artifacts and pitfalls.
Description
The basis of geostatistics- contouring and variogram modeling
This excellent summary covers the most basis aspects of geostatistics- hand and computer contouring methods and techniques are covered. Includes summary of the most commonly used computer contouring algorithms and advantages and disadvantages of each. Discusses how to make your computer contour map look like a hand-drawn map and keep out extraneous mythical contours. Also included is a complete tutorial on 2D and 3D variogram calculation and interpretation. The tutorial leads the user through the practical steps to calculating and interpreting variograms – the most crucial step in geostatistics. The guide is designed for earth scientists who want to learn how to use geostatistics techniques.
Contouring is a graphic tool that can be used to represent the three dimensional spatial distribution of a measured variable. Contouring has been done by hand methods for many years, and with the advent of computers, many computer methods have been developed for producing contours. This book summarizes both hand and computer contouring methods and tells:
- Assumptions – Steps required and Results achieved with the methods
- Advantages and disadvantages of each method – When the particular method should and should not be used
The chapters include the following:
- The “Art” of Contouring
- Contouring Rules and Guidelines
- Hand Contouring (mechanical, parallel, equal-spaced, interpretive, gridding)
- Computer Contouring (methods, data storage, reasons to and not to computer contour)
- Data factors controlling results
- Estimation methods (triangulation [linear, delaunay], gridding [inverse distance, kriging, minimum curvature, trend surface, triangulation/gridding])
- Acceptability criteria for computer generated maps
- Use of histograms to check results
- Contour map artifacts and pitfalls
- Tough computer mapping problems
- Reading list and sources of computer mapping software.
Have you taken a geostatistics class and afterward felt that this was good information, but felt confused about the application of what you learned? Did you get bogged down in all the math and felt that there must be a way to look at the results which didn’t require postdoctoral work in statistics? This publication, developed by Stephen A. Krajewski and Betty Gibbs, is for you.
Except for a few equations, the primer goes step-by-step through the process of calculating variograms and interpreting the result. One-dimensional, two-dimensional, and three-dimensional variograms are covered. Explanations are given for the meaning of all the parts of a variogram, the properties of a variogram, and how they are used.
Examples are scattered through the entire book showing how variograms look when a variety of geologic conditions exist. Variogram models are explained in simple terminology – and the formulas are there if you are into that sort of thing. Pictures are also provided so you can get an idea of what the different models look like graphically. Instructions are given about how to select range values on different types of models.
The process for determining anisotropy using variograms in different directions is covered in detail. Geometric anisotropy and zonal anisotropy are defined and illustrated. Illustrations are shown about how pairs are selected.
The Recipe for Modeling Variograms section describes the process of examining and analyzing data to begin the process of understanding the geological environment using variograms as a tool to verify interpretations. Did you ever wonder how a “good” variogram looks? Some of the reasons for variogram appearance are explored and discussed.
Another section is devoted to identifying and discussing common problems encountered during variogram modeling. The problems discussed include situations where:
- Geometric anisotropy is present.
- Zonal anisotropy is present.
- Drift (trend) is present.
- Proportional effect is present.
- Nested structures are present.
- Hole effect is present.
- Periodicity is present.
Another section covers many of the pitfalls of interpreting variograms and what to do about problems that arise. How variograms are used at various stages in a project life complete the instruction.
Commercial and public domain software sources are listed and described, as well as how to obtain software. References are listed.
This Variogram Primer does not take the place of a course in geostatistics. It can be a valuable adjunct to the understanding of what you are looking at when all those little points are plotted on a graph and you don’t see how they could possibly mean anything. This nonmathematical treatment of the process as well as explanations of terminology, is a valuable resource contained in one book. Information was collected from a variety of sources and consolidated into this very meaningful and pertinent volume. If you need to create and interpret variograms but don’t want to be an expert geostatistician, you will find much valuable information in this book.
Understanding Contouring Documentation Downloads
Click on the link below to download documentation for the Understanding Contouring book.
Understanding Contouring Poster: Download the FREE Understanding Computer Contouring poster, 34 in x 44 in. (PDF 1.77 mb) This is a companion to the Understanding Contouring book.
Related products
-
Igneous petrology softwarePrice range: $299.00 through $498.00 Add to cart -
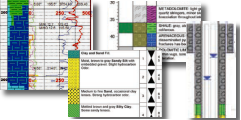
Striplog, borehole log plottingAdd to cart -
Well log visualizationAdd to cart -
Field data collection softwareAdd to cart -
Geological Modeling SoftwarePrice range: $860.00 through $6,000.00 Add to cart -
Water Chemistry DiagramsPrice range: $249.00 through $799.00 Add to cart -
Striplog, borehole log plottingPrice range: $495.00 through $2,625.00 Add to cart -
Flow, Transport, and Heat Modeling ProgramPrice range: $3,000.00 through $4,500.00 Add to cart