Featured Products
Encom Discover & Discover 3D 2012
GIS software for the geosciences
 Encom Discover is the desktop GIS designed especially for the geosciences, providing the tools to effectively compile, visualize, analyze and map spatial geoscience data. Encom Discover with MapInfo Professional has become the GIS of choice for geologists, environmental scientists, and exploration managers. Encom Discover is the desktop GIS designed especially for the geosciences, providing the tools to effectively compile, visualize, analyze and map spatial geoscience data. Encom Discover with MapInfo Professional has become the GIS of choice for geologists, environmental scientists, and exploration managers.
New features in Encom Discover 2012 include:
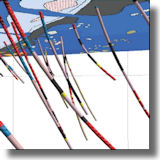
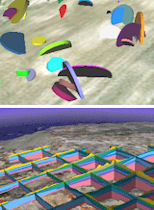
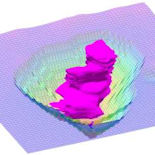
+ Visualization of both 3D vector models (such as mineralization wireframes) and Voxel / Block models on 2D cross-sections as attributed polygons, enhancing the interoperability between the 2D and 3D environments.
+ Intuitive 3D navigation with a new interactive onscreen control.
+ Projection support has been added to Discover 3D, including the automatic reprojection of datasets.
+ Numerous import/export improvements
+ Many new grid surface tools
+ A free Discover 3D Viewer, allowing Discover 3D sessions to be shared with anyone.
Read more
Get a quote
Download demo
Encom PA v12
Integrating geophysics, geology, and geochemistry
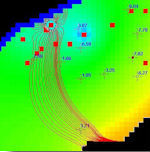
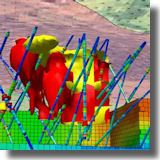 Use Encom PA to connect geophysical data, modelling, satellite imagery, geochemistry and geological mapping in a single interactive interpretation environment. A full range of analytical functions, effective presentation tools and powerful template capabilities help you to complete your expert analysis more quickly, comprehensively and effectively. Work in one environment, not four! Use Encom PA to connect geophysical data, modelling, satellite imagery, geochemistry and geological mapping in a single interactive interpretation environment. A full range of analytical functions, effective presentation tools and powerful template capabilities help you to complete your expert analysis more quickly, comprehensively and effectively. Work in one environment, not four!
What's new in Encom PA v12 -
+ Projection Tools:
View the coordinate system for a loaded data object
Detect and apply a defined coordinate system for a Geosoft GDB database
Re-project data objects in 2D Map and 3D displays
+ Processing Tools:
Compute TEM Tau (Decay Constants) for EM Data
Store Decay Constants in the Feature Database
Correct magnetic values with the Diurnal Corrections Tool
+ Workflow Tools:
Clip a voxel model to one or more vector volumes
Convert one or more polyhedron volumes to a voxel model
Zoom with the mouse scroll wheel for improved profile digitizing and anomaly picks
Read more
Encom PA pricing
Download demo
MapInfo Professional 11.5.1
Upgrade special for this mapping & geographic analysis software
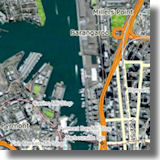 Designed to visualize the relationsips between data and geography, MapInfo Professional helps business analysts, planners, GIS professionals - even non-GIS users - gain new insights into their markets, share information-rich maps and graphs, and improve strategic decision-making. Designed to visualize the relationsips between data and geography, MapInfo Professional helps business analysts, planners, GIS professionals - even non-GIS users - gain new insights into their markets, share information-rich maps and graphs, and improve strategic decision-making.
New features in MapInfo Pro 11.5 include:
+ Create pleasing, easy-to-read legends with the new legend designer, including the ability to snap items to a grid.
+ Faster, more intuitive browser window. Drag-and-drop features offer more insight with fewer clicks.
+ Sort data based on data attributes from within browser window.
+ Improved metadata handling - Edit metadata records directly, update existing records, data validation, etc.
+ Multi-task with multiple monitors
+ New and updated projections
+ Much more
Read more
Get a quote
Download demo
Through December 31st, special pricing is offered to upgrade all versions to MapInfo Professional 11.5.1. Call RockWare at 1-800-775-6745, or use the Quote link above, for information about upgrading your existing MapInfo license.
Web Resources
RockWare Videos
New Webinar Videos on the RockWare YouTube Channel
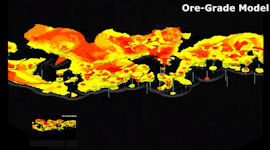
RockWorks15 - Ore Modeling and Pit Optimization
(30 seconds)
RockWorks15 - Stratigraphy Modeling Introduction
(3 minutes)
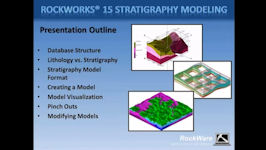
Webinar: Stratigraphy Modeling in RockWorks15
(28 minutes)
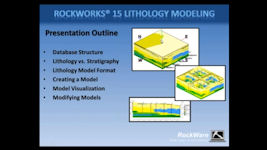
Webinar: Lithology Modeling in RockWorks15
(33 minutes)
Webinars
Upcoming Live Web Presentations on RockWorks
 Introduction to Google Earth Introduction to Google Earth
Date: Thursday, Dec 6, 2012
Time: 10 am MST (USA)
Duration: 30 min. demo/Q&A
ID: Dec2012
Full!
Additional session added:
Date: Friday, Dec 7, 2012
Time: 10 am Mountain Standard Time (USA) (9 am Pacific, 11 am Central, 12 noon Eastern US, 5 pm GMT)
Duration: 30 min. demo/Q&A
ID: Oct2012B
Click for registration information
~ ~ ~ ~ ~ ~ ~ ~ ~ ~ ~ ~
 RockWorks15 - Estimating Volumes for Grids and Block Models RockWorks15 - Estimating Volumes for Grids and Block Models
Date: Monday, Jan 7, 2013
Time: 10 am Mountain Standard Time (USA)
(9 am Pacific, 11 am Central, 12 noon Eastern US, 5 pm GMT)
Duration: 30 min. demo/Q&A
ID: Jan2013
Click for registration information
~ ~ ~ ~ ~ ~ ~ ~ ~ ~ ~ ~
 ESI Webinars ESI Webinars
Topic: Introduction to Groundwater Flow & Transport Modeling with Groundwater Vistas
Dates: December 3 - 13, 2012
Click for registration information
Topic: Calibrating Groundwater Models with PEST and Groundwater Vistas
Dates: January 7 - 17, 2013
Click for registration information
RockWare Blog
New Postings on the RockWare Blog
Exporting Lithologic Surfaces to DXF
Cool Websites
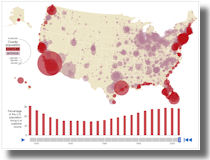
Coastline County Population Map
Visualize the percentage of the U.S. population living in a coastline county, from 1790 to 2010 in this animated map from the Census Bureau.
Speaking of coastlines, our hearts go out to all those who were affected by Hurricane Sandy along the east coast of the U.S.!
Tips
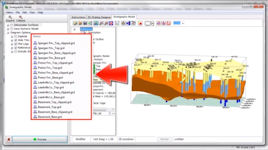
RockWorks15: Stratigraphy Modeling & Problematic Lower Units
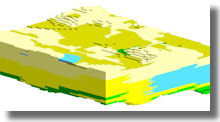
If you are modeling stratigraphy data in a project with some deep borings and some shallow, you may find that the base of the lowest formation is pulled upward in your models to the base of the shallow holes. Here's how this might look in cross section:
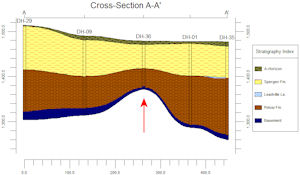
This happens when you've defined for the shallow hole a depth-to-base for the lowest unit that equals the TD of the boring. In reality, the depth to the base of that unit is not really known.
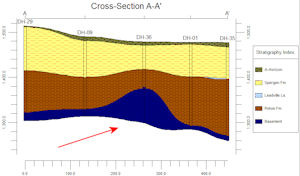
There are a few ways you can avoid this:
1. Turn on the BasePlate option for the lowest formation. This tells RockWorks simply to plot the base of that unit at a user-defined elevation, across the board.
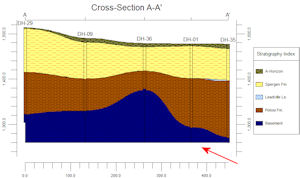
2. Delete the depth-to-base for the lowest formation in the shallow hole. This tells RockWorks to not send any information for the bottom of the base unit for that hole. The resulting surface will simply use the points from the neighboring (deeper) holes.
Read more
RockWorks pricing
Download demo

Current testing has shown that RockWorks15
and LogPlot7 each installs, licenses, and runs fine under Windows 8.
|