
RockWorks/16 Revision History
2014/Q1 (01/01/14-03/31/14)
(099) Improvement (03/31/14/MIW): The elevation grid display within RockPlot3D now uses double-precision real numbers for the internal coordinates resulting in better coloring and shading for datasets that have very large numbers with very small ranges (e.g. UTMs for very small project areas).
(098) Bug Fix (03/28/14/MIW): Quadrant-formatted data (e.g. N25E) can now be read fro the datasheet as documented.
(097) Improvement (03/27/14/MIW): The export of concave polygons from RockPlot2D to RockPlot3D has been improved.
(096) Improvement (03/25/14/MIW): Selecting multiple items within the datasheet is no longer limited to two cells on the first attempt.
(095) Bug Fix (03/22/14/JPR): The Stereonet program no longer generates a Range Check error. This fixes a recently introduced bug.
(094) Bug Fix (03/21/14/MIW): The high-cutoff filter for contour lines now works correctly.
(093) Bug Fix (03/21/14/MIW): The filled contours no longer use the optional low-cutoff filter for contour lines.
(092) Improvement (03/20/14/MIW): The Project History pull-down menu is now limited to the last ten items to speed up the processing.
(091) Improvement (03/20/14/MIW): Specifying an excessively large Title Height within the RockPlot2D pattern legend (e.g. Stratigraphy and Lithology) no longer causes the program to plot the patterns outside the column bounds and in reverse order.
(090) Improvement (03/20/14/MIW): The automatic insertion of missing units (Stratigraphic Rules / Insert Missing Units) no longer attempts to insert the lowest unit if the base of that unit is not specified within the stratigraphy tab.
(089) Improvement (03/19/14/MIW): The Select-All option within RockPLot2D now limits the seleted items to items that are visible.
(088) Improvement (03/19/14/MIW): Hiding a layer in RockPlot2D now unselects graphic items within that layer.
(087) Bug Fix (03/19/14/MIW): Raster exports from RockPlot2D for diagrams with high vertical exaggeration are now correctly centered and no longer cut off portions of the diagram along the left and bottom edges.
(086) Bug Fix (03/18/14/MIW): Water level elevations displayed within borehole location maps are now adjusted for the collar elevation.
(085) New Feature (03/18/14/MIW): The Lithology/Volumetrics, Stratigraphy/Model and Grid-Based Volumetrics programs now include options for using Spatial Filters.
(084) New Feature (03/14/14/MIW): The RockPlot/3D program now calculates bearing and inclination along with the distance computation.
(083) Improvement (03/13/14/JPR): The Borehole Manager / Stratigraphy / Model program notifies the user about missing grid models (and providing a navigation tool to find them) if the stratigraphic unit has been removed by the "Hide Thin Zones" cutoff filter.
(082) Bug Fix (03/13/14/JPR): The Borehole Manager / Stratigraphy / Model program no longer hangs-up when attempting to plot a stratigraphy model in which a stratigraphic unit has been completely removed by the "Hide Thin Zones" cutoff filter. The example below depicts an exploded stratigraphy model that has not been subjected to the Hide Thin Zones filter (left) and a model in which the filter was set to a very high value such that the uppermost unit was completely removed.

(081) Bug Fix (03/13/14/MIW): RockPlot2D no longer hangs-up when attempting to plot a very thin polygons within pattern fills.
(080) Improvement (03/12/14/MIW): Google Earth Exports from RockPlot3D are now more accurately located to compensate for a bug within Google Earth.
(079) Bug Fix (03/12/14/MIW): Profile Strip Maps no longer change size at different vertical exaggerations.
(078) Bug Fix (03/12/14/JCJ): The internal operation that tells the database that the XYZ values need to be recalculated now works correctly for both Access and SQLServer databases.
(077) Improvement (03/11/14/JCJ): Transfers from the Borehole Manager to the Utilities now include the XYZ values at the bottom of the borehole.
(076) Improvement (03/10/14/JPR): The Utilities / Widgets / Miscellaneous / GeoTime program has been redesigned to be "tablet-friendly".
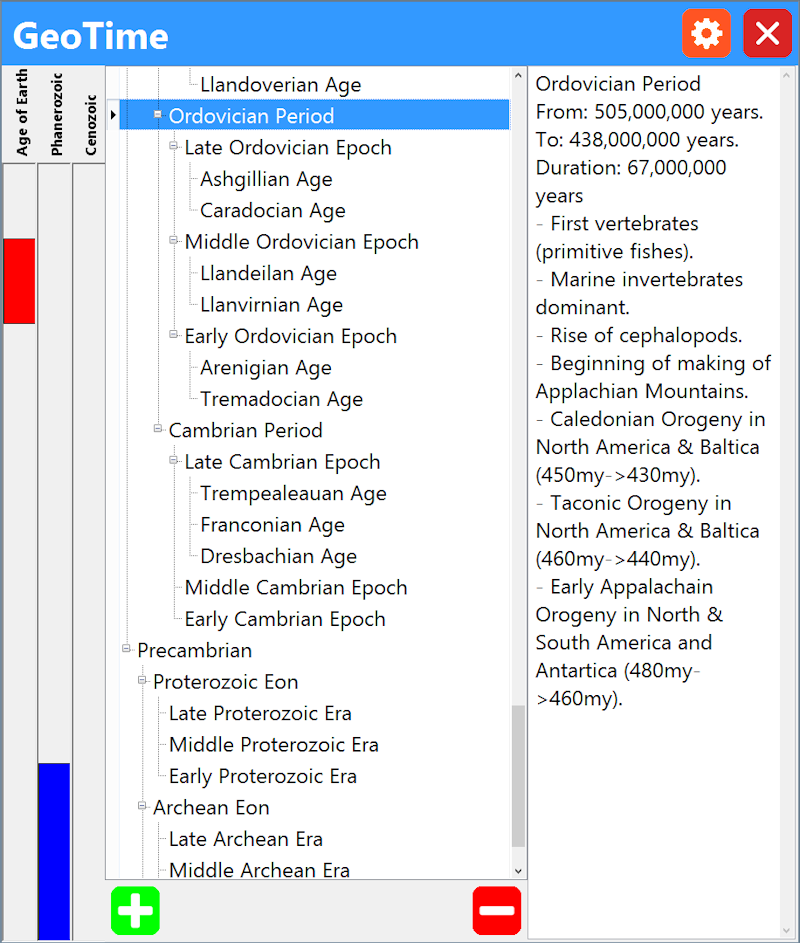
Specifically:
The font dimensions may now be changed (small to huge) via the Setup button at the top of the menu.
Scroll-bars and splitter-bars have been replaced by columns that automatically shrink and expand depending upon the content.
The buttons dimensions have been increased from 16x16 pixels to 64x64 pixels.
The graphic time bars are now vertical.
(075) New Feature (03/10/14/JPR): A new option titled "RockWare Blog" has been added to the Help / OnLine Information menu. Clicking on this button will display the RockWare blog within the default web browser.

(074) Improvement (03/10/14/JPR): The Utilities / Widgets / Miscellaneous / Periodic program has been redesigned to be "tablet-friendly" (large fonts and buttons).

(073) Bug Fix (03/10/14/JCJ): The Spatial Z-Filter no longer ignores the z-values if the color lines or color intervals are disabled.
(072) Bug Fix (03/07/14/MIW): Profile strip maps are no longer offset (by the border annotation) relative to the cross-sections.
(071) Bug Fix (03/07/14/MIW): Profile strip maps are no longer offset (by the border annotation) relative to the cross-sections.
(070) Improvement (03/06/14/JCJ): ADO and AGS imports now allow the user to suppress error dialogs so the import can continue without repeated intervention. Also the error dialog has been changed to use the Task Dialog. Required fields are no longer showing in a doubled printed fashion.
(069) Improvement (03/06/14/JCJ): XYZ calculations can now be interrupted, to await a more convenient time. In the previous version, if the user cancelled the XYZ calculations, RockWorks would cancel at the borehole it was working on but then continue with the next borehole. Now the entire operation is stopped.
(068) Improvement (03/06/14/JCJ): The KGS (Kansas Geological Survey) import program has some new "smarts" in how it handles variations within the header fields.
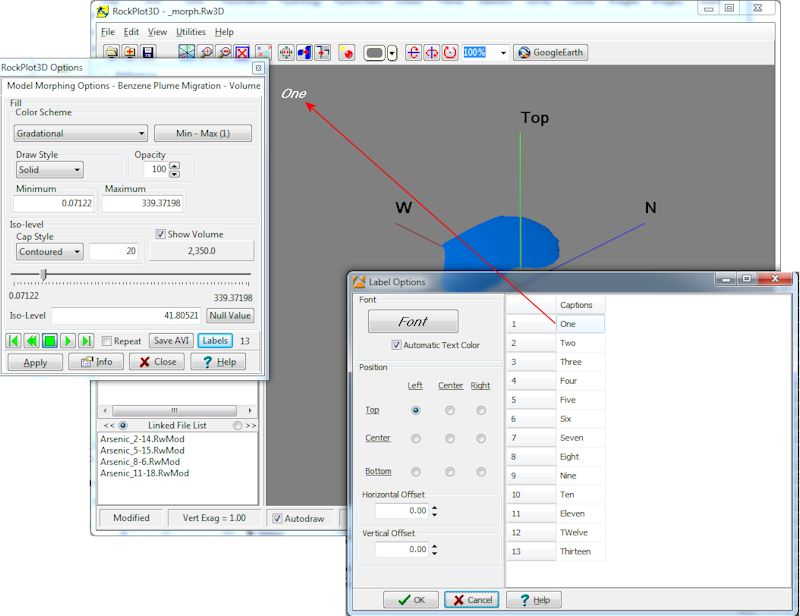
(067) New Feature (03/03/14/MIW): The RockPlot3D program now includes an option for labeling the frames within a "Morphed" model animation.
(066) New Feature (02/28/14/JCJ): The Borehole Manager / Filter and Select menus now include options for filtering or selecting based on specific aquifers as well as sampling dates. For example, you could select just the wells within the Edwards Aquifer that were sampled between August 1st, 2013 and September 1st, 2013.

(065) New Feature (02/28/14/JCJ): The Borehole Manager / Filter and Select menus now include options for filtering or selecting based on bitmap types. For example, you could select just the wells that include Induction raster logs or just the wells that include pictures of cored intervals.

(061-064) Improvements (02/28/14/JCJ): The following improvements have been made to the Borehole Manager / Filter and Select menus;
061: The edit and "comboxes" have been made wider so that the data is easier to read.
062: A status field has been added to the bottom on the menu to show the results of the changes.
063: An hourglass cursor is now displayed when plotting the borehole cartoon. This helps with projects that contain lots of boreholes.
064: Decimal places are now supported when specifying cutoff parameters.
(060) New Feature (02/28/14/MIW): A new option titled "Add Logo" has been added to the RockPlot3D Edit menu.
![]()
Clicking on the Add Logo option will present the user with a menu in which the user selects an image and it's scale and position.
![]()
The image will appear in a static, superimposed position that does not change as the the diagram is enlarged, reduced, or rotated. Also note that the logo object will be listed within the Legend heading in the data "tree" along the left side of the RockPlot3D screen. Un-checking it will render the logo invisible. Double-clicking on the item will re-activate the options dialog (shown above) thereby allowing you to edit what's already there.
![]()
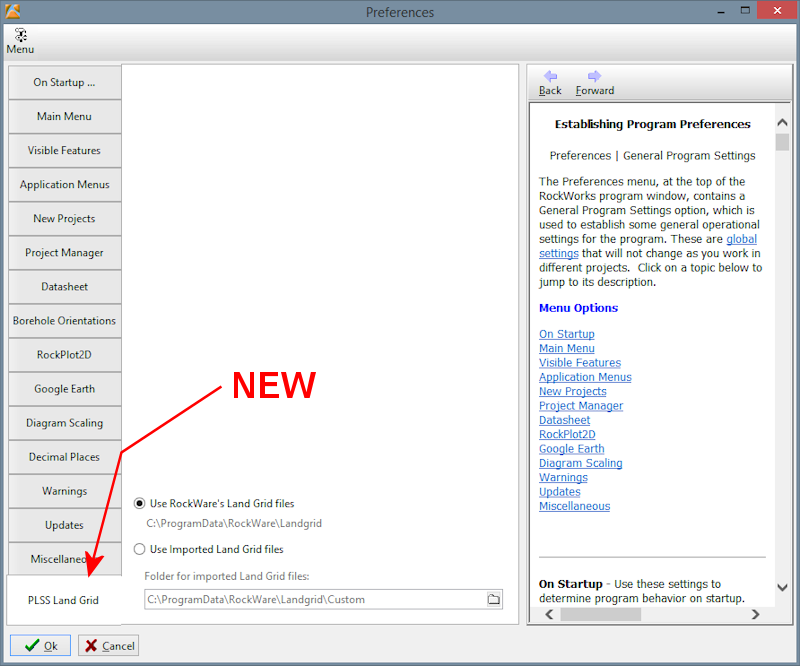
(059) New Feature (02/28/14/JCJ): A new suite of capabilities have been added to RockWorks Level-5 program for importing commercial land grid data, extracting a subset from the RockWare land grid data and entering data in a land grid editor. The user can also export and import to ASCII files. The user then generates custom land grid files that RockWorks can use instead of RockWare's land grid data.

To accomodate these new capabilities, a new tab titled "" has been added to the Preferences / General Program Settings menu.
(058) Bug Fix (02/26/14/MIW): The Grid Editor no longer generates an Access Violation error when plotting data grid points.
(057) Bug Fix (02/26/14/MIW): Importing a DXF file with layer information into RockPlot2D no longer places them within the incorrect layer.
(056) New Feature (02/25/14/MIW): A new option titled "Add Label" has been added to the RockPlot3D Edit menu.

Clicking on the Add Label option will present the user with a menu that includes the label caption, font style/dimensions, and position settings.

The caption will appear in a static, superimposed position that does not change as the the diagram is enlarged, reduced, or rotated. Also note that the label object will be listed within the Legend heading in the data "tree" along the left side of the RockPlot3D screen. Un-checking it will render the label invisible. Double-clicking on the item will re-activate the options dialog (shown above) thereby allowing you to edit what's already there.

(055) New Feature (02/18/14/MIW): The Project Folder label at the top of the main RockWorks menu has been replaced with a drop-down list containing a history list of recent projects and Browse option for navigating to a project folder.

(050-054) New Feature (02/14/14/MIW): A new "dip gridding" capability has been added to the RockWorks surface (grid) modeling. This new algorithm will bias the surface modeling based on the dip-direction and dip-angle of the control points. The algorithm also accommodates points for which the dip is unknown. Here's how it works;
Consider the control points listed and mapped within the following diagram. Each of the points has a z-value (elevation) of zero. A contour map would be nonsensical because a gridded surface would be a horizontal plane.

Now, let's pretend that we have dip information (e.g. strike & dip or dip-direction & dip-angle) for some of these points as shown within the diagram below;

The new dip-gridding algorithm will use the dip information (for the points that have it) to construct imaginary planes that are used to bias the modeling as shown by the example shown below. Notice how the points without dip information constrain the modeling.

The following new programs and modifications to existing program been made to accomodate the new dip gridding capability;
(051) A new program titled "Dip Direction & Angle -> Grid" has been added to the Utilities / Planes menu. This program will create a structural grid and contour map using the new dip-gridding algorithm and plot (as an option) strike-and-dip symbols at the control point locations (see below).

(052) Five new options have been added to the Utilities / Map / Grid-Based Map menu;

(053) A new algorithm titled "Dip" has been added to the Gridding Options menu along with a group of options pertaining to the nuances of dip gridding.

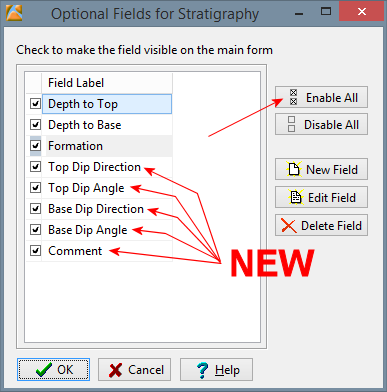
(054) The Stratigraphy table within the RockWorks Borehole Manager now includes fields for entering optional dip-direction and dip-angle field for the superface (top) and subface (bottom) contacts.

Note: To show the dip-direction/angle fields within the Stratigraphy Table;
Select the Borehole Manager / View / Tab Manager option ...

Select the Stratigraphy option from the Tab Manager and then click on the Edit Fields button ...

Select the Enable All option from the "Optional FIelds for Stratigraphy" menu.
If you're using a competing software package that doesn't have this capability, just wait - they'll steal it soon enough, just like they always do. Was that snarky?
(049) Bug Fix (02/07/14/JPR): The Preferences / General Program Settings / Application Menus / Menu Dimensions options now work correctly. The previous version would always show the application menus in full-screen mode.
(048) Bug Fix (02/07/14/MIW): Numeric data is now saved within XML files in a US format.
(047) Improvement (02/05/14/MIW): The RockPlot2D Color Legend interval now exactly matches the interval used in the Color Contours. The program adjusts the user entered minimum and maximum values so that it can be evenly divided by the interval.
(046) Bug Fix (02/05/14/MIW): All the 3D Fault Options are now saved.
(045) Improvement (02/04/14/JCJ): Improved how SQL Server scripts are generated and sent to the server. Specifically for adding new foreign key tables. Opening a new SQL Server based project will work for both Integrated Security (Trusted Connections) and Standard Security
(044) Bug Fix (02/04/14/JCJ): Fixed a bug within the XYZ calculations whereby the same values for X1, Y1, Z1 would be put into the X2, Y2, Z2 fields
(043) Improvement (02/03/14/MIW): Changed the strategy for plotting 3D borehole logs. Columns that are offset from the axis are now just shifted horizontally into position rather than trying to make them perpendicular to the axis. This eliminates some of the apparent "twisting" within deviated boreholes.
(042) New Feature (02/01/14/JPR): The 3D striplog designer now includes options that determine if the original bitmap aspect (width:height ratio) will be preserved or horizontally stretched or reduced to fill the designated column. This new capability is identical to that described within Revision #36 for two-dimensional striplogs.

The following example depicts two versions of a measured section across the face of a small hill plotted as a deviated borehole.

The stretched images may appear more asthetically pleasing, but a closer examination (shown below) illustrates the differences.

(041) Bug Fix (02/01/14/JPR): Cylindrical entities within 3D logs may now have relative radii less than 0.1% of the project dimensions.
(040) Bug Fix (01/31/14/MIW): RockPlot3D no longer draws odd edge-panels when plotting onlapped stratigraphy models and cross-sections. This bug occured when there were breaks in the edge profile occupied by null values.
(039) Improvement (01/31/14/JCJ): The datasheet->Excel export now provides an option for setting the file name from the menu.
(038) Improvement (01/31/14/JCJ): The datasheet->Excel export now allows the user to choose whether to edit the export or not.
(037) Bug Fix (01/31/14/JCJ): When editing a datasheet that is a sub-sheet to a master datasheet (i.e. a datasheet that contains a list of datasheets), clicking on the "X" (close) button within the upper-right corner of the dialog will prompt the user to save or discard the changes (if any have been made). The previous version would close the datasheet and discard any changes.
(036) New Feature (01/31/14/JPR): The 2D striplog designer now includes options that determine if the original bitmap aspect (width:height ratio) will be preserved or horizontally stretched or reduced to fill the designated column.

The Aspect Ratio / Preserve option will maintain the original image aspect ratio such that the image is not distorted. This is especially useful when viewing poor-quality raster logs. The downside is that the image has no regard for the designated column width. It can be narrower or wider depending upon the width:height ratio of the original image. As a consequence, it is advised to place the bitmap column at the right edge of the log and to turn off the Column Perimeter. In the diagram below, notice how some of the bitmaps are narrower than the orange column perimeter while others extend outside it.

The Stretch/Reduce option will horizontally stretch or reduce the images such that they fit within the designated column width, regardless of the original image aspect ratio. This produces a more uniform appearance within cross-sections but the images may be distorted. For example, compare the readibility of the poor quality raster e-log on the far left with the same log in the diagram above. Also compare the core images on the far right.

As a final example of the advantages and disadvantages of preserving the aspect ratio, consider the two logs below that represent a measured section (imaginary borehole based on an outcrop). The log at the top preserves the aspect ratio within the bitmaps while the log below it stretches / squishes the images to fit the designated bitmap column.

(036) New Feature (01/30/14/JPR): The 3D striplog designer now includes options for selecting which types of bitmaps (e.g. raster log types, core photographs, outcrop photographs, etc).

This provides a means to select what types of bitmaps will be displayed within the 3D logs as shown by the following example in which the upper diagram shows "All Types" while the lower diagram shows "Specific / Raster Logs".

The new Bitmap Types table is described within Revision #30 (below).
(035) Improvement (01/30/14/JCJ): The cursor is now automatically positioned on the upper left-most cell when a Borehole Manager table is edited as a datasheet.
(034) Bug Fix (01/30/14/JCJ): Selecting a block of cells within the datasheet no longer sporadically produces a "range check" error.
(033) New Feature (01/30/14/JCJ): A "Select All" button (Ctrl-A) has been added to datasheet that is used by the Utilities and the EarthApps.
(032) Improvement (01/30/14/JCJ): Logging in to the SQL server version now supports both Microsoft "standard" and "integrated" security protocols.
(031) New Feature (01/30/14/MIW):
Deviated Borehole Surveys now have 2 functions to reduce noisy azimuth data
which can be a problem with automated collection tools. These options are
located within a new tab titled "Borehole Orientations" within the Preferences
menu.
1. The first option takes surveys with near vertical dip and
replaces the azimuth with either the azimuth of the last survey or a user
specified azimuth.
2. The second option applies a moving average to the
azimuths which can be limited by to near vertical surveys.

The effects of these tools are most dramatic when the items that are being plotted are offset from the log axis as shown by the diagram below.

(030) New Feature (01/30/14/JPR): A new field (column) titled "Bitmap Type" has been added to the borehole Bitmaps table. The basic idea behind this new capability is to provide a means for switching between the type of image that is displayed within logs and cross-sections. For example, on Monday, you might want to plot a cross-section in which the logs include raster electric logs whereas on Tuesday, you might want to show photographs of the core.

These bitmap types are defined within a user-maintained table that is accessed by either clicking on the new "Bitmap Types" button at the top of the Bitmaps table or by double-clicking on a cell within the Bitmap Type data column.

In addition, the bitmap plotting menu within the 2D borehole designer now includes options for specifying which of these bitmap types to include within the graphic logs.

In the example below, the "Types of Bitmaps To Display" for the upper cross-section was set to "All Types" whereas the lower cross-section used the "Specific / Outcrop Photo" setting.

(029) Bug Fix (01/29/14/JPR): The Utilities / Map / Polylines Map program no longer generates a "range" error.
(028) Improvement (01/28/14/MIW): The displayed decimal places within the Preferences dialog has been moved to a new tab titled "Decimal Places". This setting was previously displayed on the Data Sheet tab but that proved misleading because it also applied to the decimal places displayed within menu trees. The upper limit has been increased from 10 to 20 decimal places and effects the display of floating point numbers in the Borehole Manager, Data Sheet and Menus. This change was required for menu settings where very small real numbers were required.
(026-027) New Features (01/28/14/JPR): A pair of programs for connecting and plotting dip measurements had been added to the Utilities / Planes sub-menu under the heading of "Dips -> Ribbons".
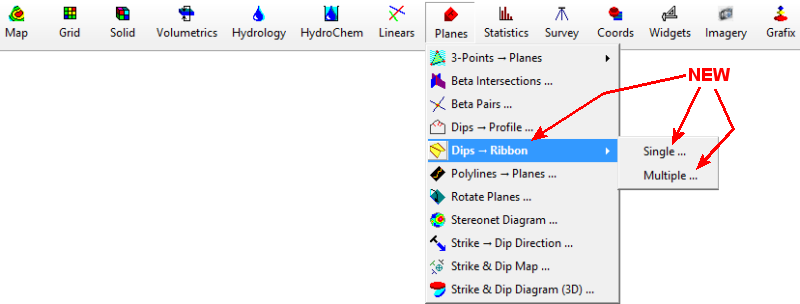
(026) The Dips -> Ribbons / Single program reads a list of dip data (e.g. points along a fault, contact, bedding plane) as shown by the following example.

A smoothed curve is then fitted to the points (in the order that they're listed) and a ribbon-like surface is then displayed in which a surface is projected up-dip and/or down-dip from the smoothed curve as shown below.
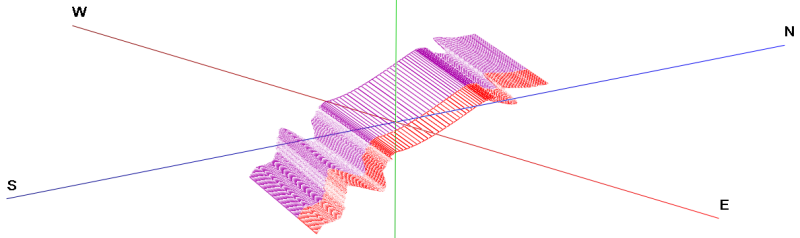
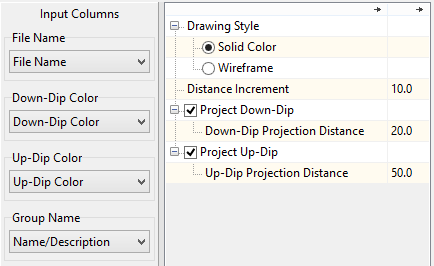
The Dip-Ribbons / Single menu (shown below) provides options for projecting the surface either down-dip or up-dip by a specified distance (in project units).

The ability to independently color the projection for the up-dip and down-dip portions of the "ribbon" provides a means to distinguish between what should be above the ground surface and what should be below the ground surface. For example, the diagram below depicts a thrust fault that is being projected above the current ground surface by exporting the output to Google Earth. The small segments of purple show the portions of the thrust that are below the ground surface. The fact that they're visible in some areas show a difference between the Z-coordinate that was entered into the datasheet (from a GPS) and the elevations within the Google Earth terrain model.

(027) The Dips -> Ribbons / Multiple program reads a list of dip data files (described above) and plots them all as a single diagram. An example of the input for this program is shown by the following data table;

Unlike the Dip-Ribbons/Single program, the Dip->Ribbons/Multiple program reads the colors for the down-dip and up-dip portions of the ribbon as data columns, thereby allowing for separate coloring of the different ribbons.
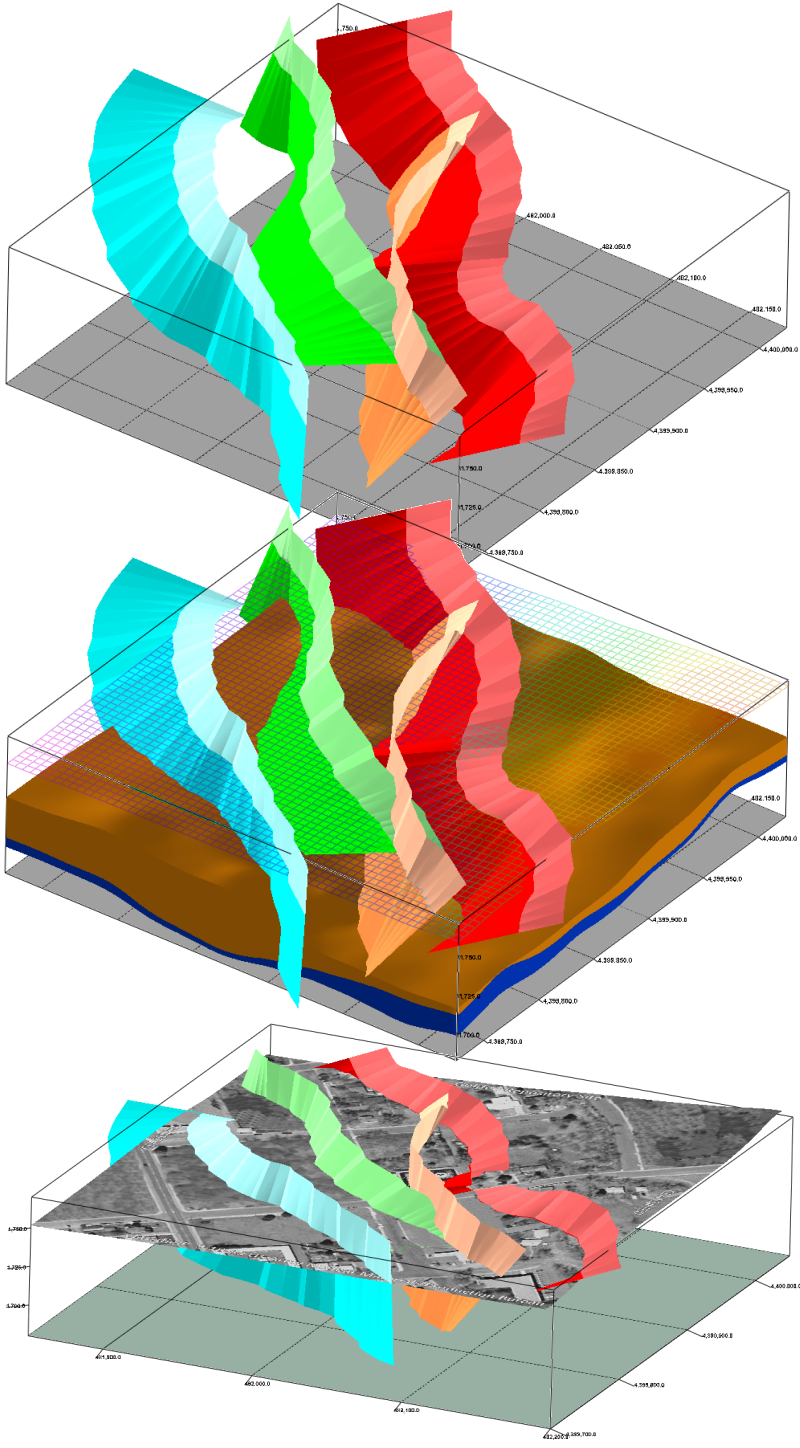
In the example below, a thrust fault (red) is projected above the ground surface while a folded bedding surface is displayed in blue above the ground surface and green below it.

In order to demonstrate these new capabilities, some of the existing sample/tutorial files have been modified and some new files have been added. Specifically;
Columns of Dip Direction and Dip Angle data have been added to the following files. These files may now be used to demonstrate both the Utilities / Map / Polyline Maps and the Utilities / Planes / Dips -> Ribbons programs.
Thrust_Fault_Antler_01.rwdat
Thrust_Fault_Laramide_01.rwdat
Thrust_Fault_Palisades_01.rwdat
Thrust_Fault_Sevier_01.rwdat
Thrust_Fault_Taconic_01.rwdat
A new file title Dip_Ribbons_01.rwdat has been added to demonstrate the Utilities / Planes / Dips -> Ribbons / Multiple program. The output from this file is shown below in conjunction with a stratigraphic model (center diagram) and a draped air photo (lower diagram).
(023-025) New Features (01/28/14/JPR): A new suite of programs for plotting well production data has been added to the Utilities / Statististics menu under the sub-heading labeled "Well Production".

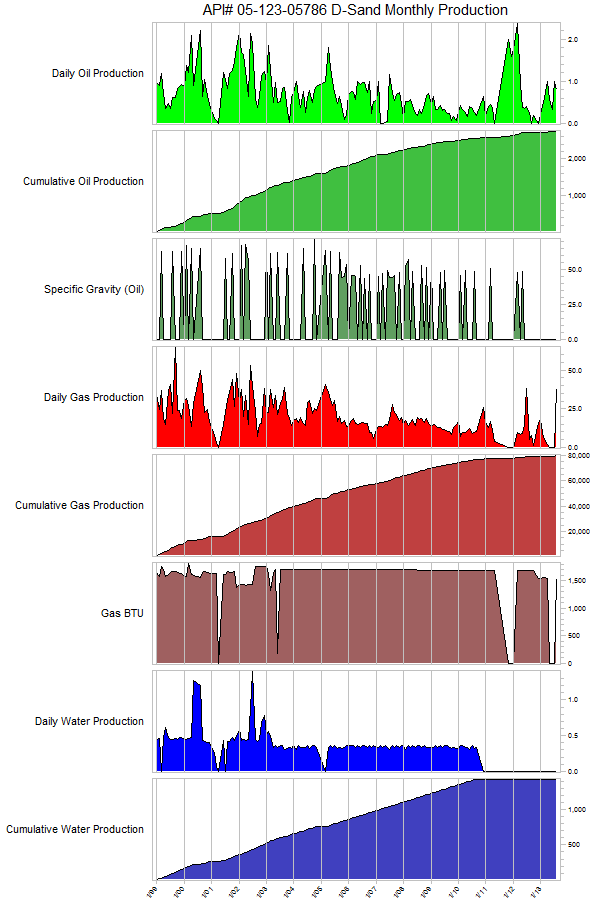
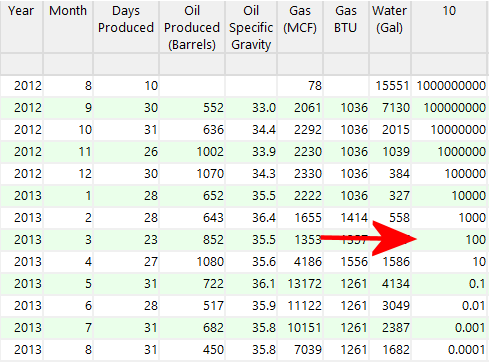
(023) The Single-Well program reads monthly production data from a datasheet and creates a graph that shows various production parameters over time. An example of the input is shown below.

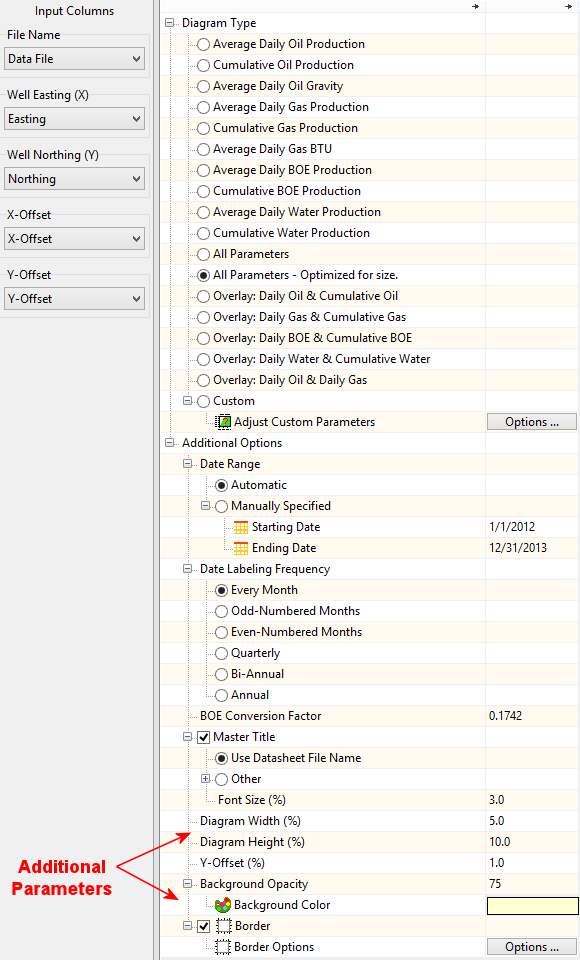
The Year, Month, and Days Produced are required fields whereas the Oil Produced, API Gravity, GAS, BTU and Water columns may be blank. Once selected, the Single-Well menu (shown fully-expanded below) allows the user to select from a myriad of possible graph types.

This program will compute average daily parameters by dividing the input by the number of days produced within the month. The output may include a single graph, stacked graphs showing multiple parameters, or overlain graphs showing properties superimposed on graphs depicting other parameters.
Specific items within the Single Well menu that merit explanation are described as follows;
Adjust Custom Parameters: This option provides access to a menu that allows the user to change a variety of parameters (e.g. symbol dimensions, line styles) that are used to generate the various graphs.

The vertical axis labeling within the custom parameters merits some additional explanation. Specifically, consider plotting the data within column 10 in the following example.
The diagram shown below shows what the data would look like when plotted using a linear scale.

When plotted on a logarithmic scale, the diagram looks like the example shown below. Notice how the vertical spacing between the y-axis tick marks shows the logarithmic scaling.

If the "Label Minor Intervals" option is checked, the diagram looks like the example shown below. Notice how the minor interval labels are set to half the size of the major interval labels. Also notice how the program automatically omits minor interval labels that would overplot other labels.

In addition, the customization menu also includes a layout tool for creating multiple-parameter diagrams;

Date-Range / Automatic: If this item is checked, the program will base the data range on the earliest an latest dates encountered within the input file.
BOE Conversion Factor: BOE (Barrels of Oil Equivalent) are computed by multiplying the gas production by this number and adding it the oil number.
A sample file titled "Production_01.rwdat" has been added to the Samples folder in order to demonstrate this program..
(024) Multi-Well Map: To use the Multi-Well Map program, an RWDAT (datasheet) file must be created for each well. A new datasheet is then created that lists these files and the coordinates for each of the wells. Two additional columns are also specified for offsetting these diagram on a map to manually prevent over-plotting as shown by the following example.

The Multi-Well Map menu is similar to the Single-Well menu with some additional parameters for defining the relative size and opacity of the diagrams within the map.
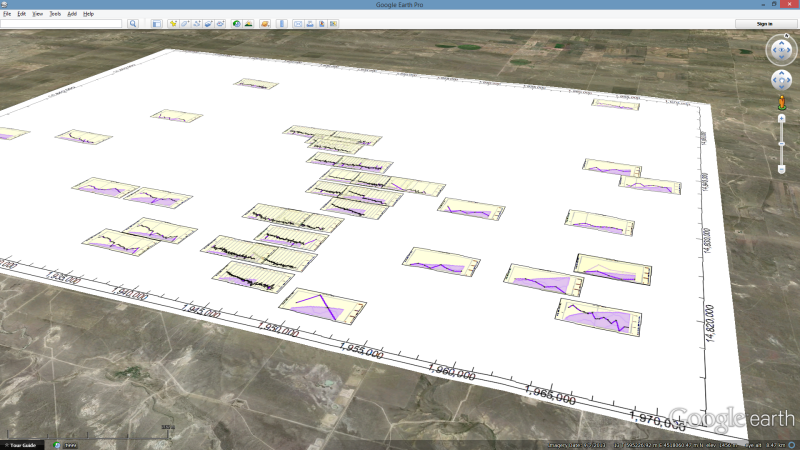
Creating a map with the Multi-Well Map program (see below) requires considerably more effort than the Single-Well program. Specifically, defining the offsets to prevent overplotting, specifing the optimum dimensions, etc. will take some time.

As with all RockPlot2D maps, the output may be easily exported to Google Earth as shown below.
(025) The Multi-Well 3D Diagram program is similar to the Multi-Well Map program except that it's much easier to use because there is no need to worry about the overplotting and there are fewer diagram-type options.

The input file for the Multi-Well 3D Diagram program is identical to the Multi-Well Map program except that the offset columns may be omitted or ignored (i.e. a single file can serve both programs). The output however is rendered in RockPlot3D whereby the selected parameter is rendered as a horizontal disc in which the radius is proportional to the magnitude of the parameter. The net result is shown by the example below in which cumulative BOE within a two-year time span is depicted.

The discs may also be color-coded in proportion to the quantity as shown by the following diagram depicting average daily production. This is essentially a three-dimensional, multi-well, production decline plot.

As with all RockPlot3D diagrams, these plots may be easily exported to Google Earth as shown by the following example depicting cumulative water production over a 15-year period.

A video depicting a case-study within Weld County, Colorado (D-Sand, J-Sand and Niobrara Formations) may be viewed by clicking here ---> Niobrara Case Study.
(022) Bug Fix (01/28/14/MIW): In RockPlot3D using a color table not sorted by value now correctly uses the tables colors in Iso-Surfaces.
(021) New Feature (01/28/14/MIW): The titles within RockPlot3D Color Legends that use a color table now display the value range for each interval.
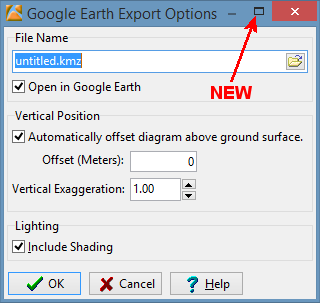
(020) New Feature (01/27/14/JPR): The RockPlot3D / Google Earth Export menu may now includes an option that allows the user to disable the automatic offsetting that vertically shifts all data upwards such that the lowest point within the diagram corresponds to the ground surface.

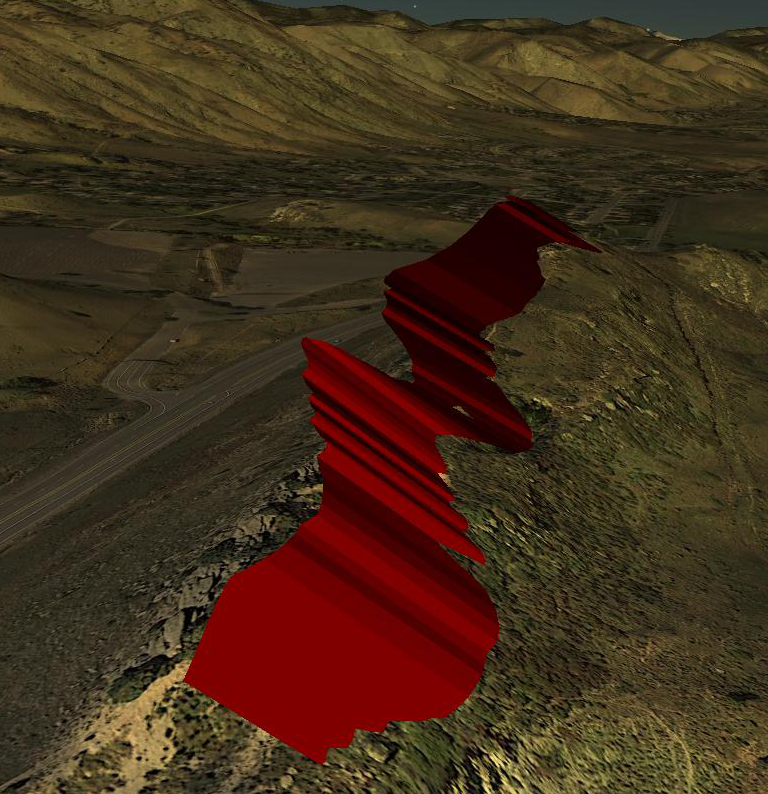
Disabling the automatic offset is useful when plotting objects above the ground surface at their proper elevation and for projecting objects above the ground surface. The following example shows a thrust fault projected from the outcrop line into space. Without the ability to disable the automatic offset, this fault surface would be plotted incorrectly.
(019) Improvement (01/27/14/JPR): The RockPlot3D / Google Earth Export menu may now be expanded to provide more space for reviewing the output file name.
(018) Bug Fix (01/24/14/MIW): Fixed an issue with stratigraphic data for modeling data based on collar elevations.
(017) Bug Fix & Improvement (01/24/14/MIW): Fixed and enhanced the plotting of logs in Strip Logs, Sections, Projected Sections, Profiles and Fences when using Collar Elevations.
(016) Improvement (01/22/14/JPR): The menu hide/show button has been relocated to a vertical strip between the tree-menu and the display area within all RockWorks menus.

(015) Bug Fix (01/22/14/MIW): The RockPlot2D program no longer generates occasional access-violation error messages when displaying newly created diagrams.
(014) Bug Fix (01/22/14/MIW): The collar setting for stratigraphy is now honored when using the StripLogs / 2-Dimensional / Section and StripLogs / 3-Dimensional / Multiple-Logs programs with stratigraphic correlations.
(013) Bug Fix (01/21/14/MIW): Exporting raster files from RockPlot2D with a World File now takes the margin into account when computing the image coordinates.
(012) New Feature (01/17/14/MIW): Added the ability to add collar offset distances to the Projected Section diagrams.
(011) Bug Fix (01/16/14/MIW): The P-Data modeling no longer generates an access-violation error when the filtering option is activated.
(010) Improvement (01/16/14/MIW): The RockPlot/3D cage label positioning has been improved.
(009) Bug Fix (01/16/14/MIW): The RockPlot/3D / ESRI Shape export no longer places the output in the wrong folder.
(008) Improvement (01/16/14/MIW): The RockPlot/3D color legend label positioning has been improved
(007) Bug Fix (01/16/14/MIW): The Profile / Parallel Profiles no longer generates an access-violation error.
(006) Bug Fix (01/16/14/MIW): The ReportWorks text label borders are no longer included within the printed output when deactivated.
(005) Bug Fix (01/16/14/MIW): The Color Modeling no longer generates an access-violation error when declustering is activated.
(004) New Feature (01/16/14/MIW): Added "null logic" options to the Grid & Grid Math. The previous versions would always put a null in the resulting grid if either of the input grid cells was null. Now the user can specify the value if either input is null. In addition, the user can set the input null value to 0, 1 or a custom value.
(003) Bug Fix (01/16/14/MIW): The Grid Statistics Report program no longer generates and access-violation error if all of the grid node values are equal.
(002) Bug Fix (01/16/14/MIW): RockPlot3D color legends no longer shrink when more intervals are added.
(001) Cosmetic (01/12/14/JPR): The "Minor Tick Intervals" caption within the 2D Striplog Designer has been changed to "Minor Ticks Per Major Interval".
