
RockWorks/2004 Revision History
2005/Q2 (04/01/05-06/30/05)
- Uploaded 6/30/05 -
(65) Bug Fix (06/30/05/JPR): Two-dimensional contour maps now omit regions where the node values are null (i.e. z_node = -1.0e27).
(64) Bug Fix (06/30/05/JPR): The Geological Utilities / Map / Land-Grid / Section-Map menu no longer lists the map projection options twice.
(63) New Feature (06/29/05/MIW): The RockPlot/3D Grid Options menu now includes options for specifying the color banding (or blending).

These options are illustrated within the following diagram;

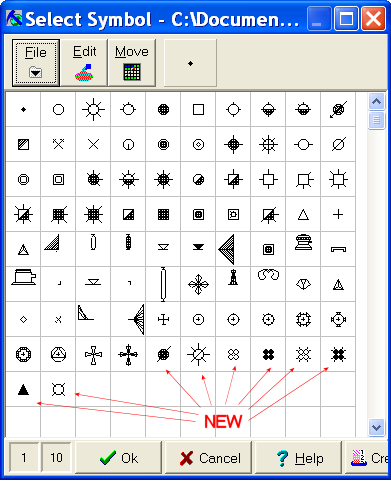
(62) New Feature (06/29/05/JPR): Several new symbols have been added to the symbol library.
(61) New Feature (06/29/05/JPR): Critical errors now generate a "bug report" that can be automatically sent to the RockWare support staff. This report keeps us from asking a bunch of obnoxious questions about your machine configuration and exactly where the bug occurred.

(60) Bug Fix (06/29/05/JPR): The Geological Utilities / Map / EZ-Map program now labels the proper intervals. The previous version got things reversed; contours that should not be labeled were labeled which contours that should have been labeled were not labeled. The same bug applied to the custom contour table.
(59) New Feature (06/28/05/JPR): The Geological Utilities / Map / Land-Grid / Section-Map program will now read the "point stream" data (see item #58 below) when plotting the section outlines. If the item within the "Points" column is blank or zero, the program will use the main corner points. The difference in map quality for regions with irregular/truncated section borders can be dramatic. Conversely, typical range and townships will not look any different.

Note: This is the only program that uses the Points and Point Stream column data - all other programs such as the well-spotting, lease plotting, and township border plotting use the main corner points. For example, note how the township borders within the following example diagram use the main corner points.

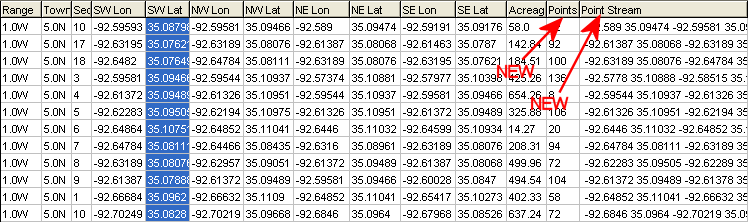
(58) New Feature (06/28/05/JPR): The Tables / Land-Grid / Import program now includes a column that list the number of actual vertices that define the perimeter of the section as well as another new column that contains the coordinates for these points.
(57) New Feature (06/28/05/JPR): The Tables / Land-Grid / Import program now includes an option for reading Jeffersonian land grid data from Tobin TDRBM II files.

(56) New Feature (06/27/05/JPR): A new program titled "Tobin WCS" has been added to the File / Import / Borehole Manager menu. The Tobin WCS program is used to import selected Tobin "Well Coordinate Service" (WCS) file data into the RockWorks Borehole Manager database.
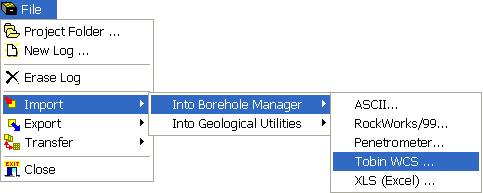
Once it has been selected, the Tobin WCS -> Borehole manager program will ask the user for the name of the WCS file and import the data (as shown below), into the Borehole Manager database.

Note: The well symbol is determined by comparing the status field with the contents of the new Well Status table (see item #60).
(60) New Feature (06/27/05/JPR): A new type of table, called a "Well Status Table" has been added to the Tables menu.

This table contains a list of well status terms/acronyms (e.g. O&G, D&A, DRY, etc.) and the map symbols that are associated with these acronyms.
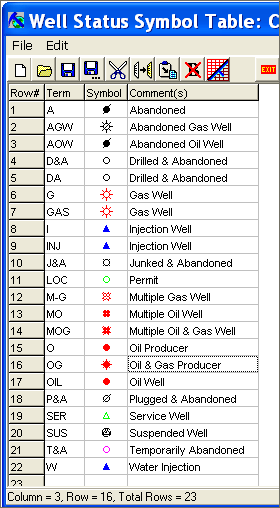
The Well Status Table is used by the new Tobin import programs (see items #56 and #61).
(59) Cosmetic (06/27/05/JPR): The Borehole Manager / Location / Comments listing now uses a non-proportional font such that columnar data will vertically align.

(58) Cosmetic (06/21/05/JPR): The Borehole Manager Location fields are now listed in a vertical scroll box that is separated into "Required" and "Optional" fields.

(57) New Feature (06/21/05/JPR): The Borehole Manager Location tab now includes a button at the base of the page titled "Hide / Unhide Optional Fields".

The Hide/Unhide button will present the user with a menu that determines which of the optional fields (e.g. Longitude, Latitude, Range, Township, Section, Legal) will be displayed within the Location tab.
(56) New Feature (06/18/05/JPR): A new program titled "Tobin WCS" has been added to the File / Import / Geological-Utilities menu. The Tobin WCS program is used to import selected Tobin "Well Coordinate Service" (WCS) file data into the RockWorks Geological Utilities datasheet.

Once it has been selected, the Tobin WCS -> Geological Utilities program will present the user with a list of fields that may be imported into the Geological Utilities datasheet. It is also possible to designate which columns will be used for the subsequent import.

Once the user has selected the fields to be imported, the data will be loaded into the Geological Utilities datasheet.

Note: The symbol is determined by comparing the status field with the contents of the new Well Status table (see item #60).
- Uploaded 6/18/05 -
(55) Bug Fix (06/18/05/JPR): Dots within patterns are now plotted correctly when the pattern line thickness is set to 1. The previous version would not plot dots unless the pattern line thickness was set to 2 or higher.

- Uploaded 6/17/05 -
(54) Bug Fix (06/17/05/MIW): The Grid / Import / ESRI - ASCII program has been fixed. The previous version would generate an access-violation error.
(53) Bug Fix (06/16/05/JPR): It is now possible to modify a color legend within RockPlot/2D if the vertical exaggeration is not equal to 1.0. The previous version would produce frustrating results if the exaggeration was high (e.g. 10.0) and the user attempted to change the size of the legend.
(52) Bug Fix (06/16/05/JPR): It is now possible to modify a pattern legend (i.e. lithology or stratigraphy) within RockPlot/2D if the vertical exaggeration is not equal to 1.0. The previous version would produce frustrating results if the exaggeration was high (e.g. 10.0) and the user attempted to change the size of the pattern legend.
- Uploaded 6/10/05 -
(51) New Feature (06/10/05/JPR): The 2-dimensional font dimensions are now correctly identified when the Windows region settings are set to Greek.
(50) New Feature (06/10/05/JPR): A new command titled "DIMENSIONS" has been added to the RCL (RockWare Command Language). This command is used to define the parameters that would normally be set within the Project-Dimensions dialog box.
Syntax:
DIMENSIONS: X_MIN X_MAX X_SPACING Y_MIN Y_MAX Y_SPACING Z_MIN Z_MAX Z_SPACING
Example:
DIMENSIONS: 9800 11600 50 9000 10800 50 1000 2400 50
(49) Bug Fix (06/09/05/JPR): The lower-eastern axis annotation within three-dimensional "cages" is now plotted correctly. The previous version would offset the labels too far to the east within selected data sets.
- Uploaded 6/6/05 -
(48) Bug Fix (06/05/05/JPR): The Geological Utilities / Map / ShotPoints program no longer generates an error message if the "Plot All Lines" option is activated.
(47) Bug Fix (06/02/05/JPR): The Geological Utilities / Planes / One-Set program now computes the proper strike, and dip-direction.
(46) Bug Fix (05/26/05/MIW): The Borehole Manager strip log title font size may now be less than 1.0 when running in the Euro number format.
(45) Bug Fix (05/25/05/MIW): The Geological Utilities / Solid / Plan pgoram now displays the data in RockPlot/2D as a plan-view map rather than a 3D map within RockPlot/3D.
(44) Bug Fix (05/24/05/MIW): The Borehole Manager / Stratigraphy / Export / ASCII XYZ File program now works correctly. The previous version required that the user generate a stratigraphy model (or something similar that re-processed the necessary binary files) prior to executing the export program.
(43) Bug Fix (05/23/05/MIW): The Project Dimensions menu now updates the number of x, y, and z nodes after scanning the data.
(42) Improvement (05/22/05/JPR): The user no longer needs to select the appropriate datasheet before using the Borehole Manager import programs listed below. Instead, the program will automatically display the appropriate datasheet prior to the importation of the data.
Lithology / Import / Fugro CPT Data
Lithology / Import / RockWorks99 Lithology File
I-Data / Import / RockWorks99 Histogram File
P-Data / Import / Colog File
P-Data / Import / Fugro CPT Data
P-Data / Import / Rockworks99 Curve File
(41) New Feature (05/21/05/JPR): A new program titled "Import Fugro CPT Data" has been added to the Borehole-Manager / P-Data / Import menu.

This program imports quantitative downhole data from a Fugro CPT file into a p-data table.
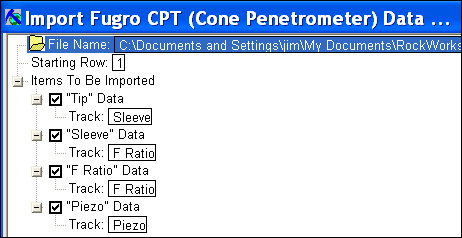
Note: The column titles should be defined before attempting to import Fugro CPT data.
For more information about Fugro CPT files, please refer to www.fugro.com.
(40) New Feature (05/20/05/JPR): A new program titled "Import Fugro CPT Data" has been added to the Borehole-Manager / Lithology / Import menu.

This program imports lithology data from a Fugro CPT file into a lithology table. In the process, the program will concatenate similar intervals such that the lithology doesn't consist of hundreds of small intervals.
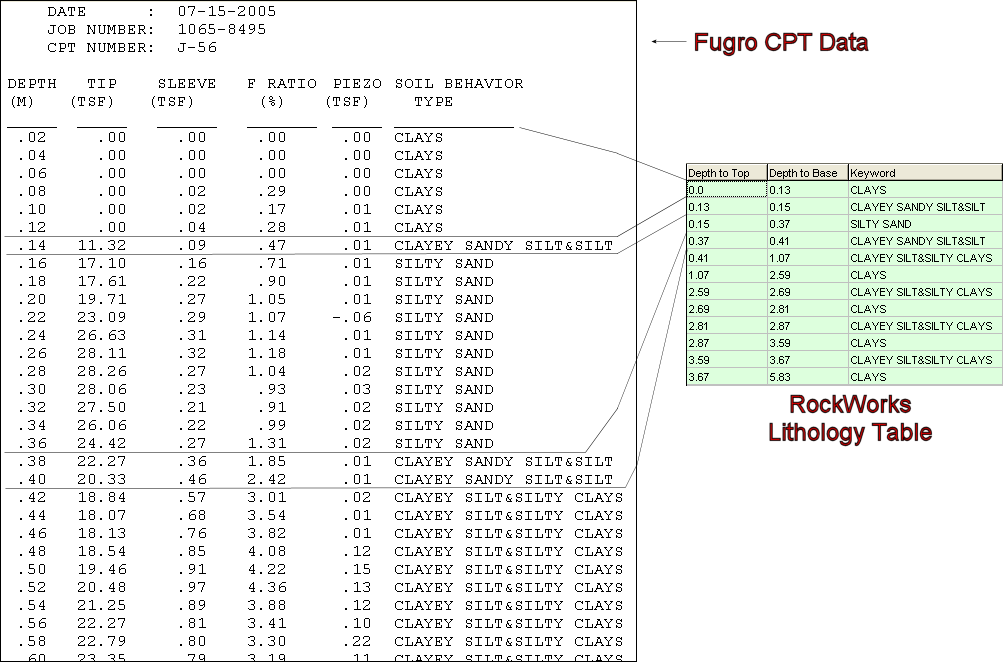
For more information about Fugro CPT files, please refer to www.fugro.com.
(39) Bug Fix (05/19/05/JPR): The Borehole-Manager / File / Project-Folder option now works correctly.
(38) Bug Fix (05/19/05/MIW): Duplicate points within pattern outlines no longer produce an error message.
(37) Bug Fix (05/18/05/MIW): The layering option within the DXF export option now works correctly.
(36) New Feature (05/17/05/MIW): The ReportWorks program now includes an option for plotting a keyword index.
(35) Bug Fix (05/16/05/MIW): Solid filled polygons and symbols within older (pre 5.3.21) 2D graphic files are now correctly converted to the newer object-oriented graphic format.
(34) New Feature (05/15/05/JPR): The program no longer includes "null" node values (z=-1.0e27) when computing default contour intervals based on grid models.
(33) New Feature (05/14/05/JPR): The Geological-Utilities / Grid / Stats / Histogram program will now ignore any "null" node values (z=-1.0e27) within a grid model.
(32) New Feature (05/13/05/JPR): The Geological-Utilities / Grid / Stats / Report program output now lists the number of "null" values (z = -1.0e27) within a grid model. In addition, these values are not included in the statistical calculations.
| Grid Model Statistics --------------------- Grid Name ................................. C:\Documents and Settings\jim\My Documents\Missouri Fractures\EUREKA_MO_10Meter.grd Dimensions: X-Minimum (western-most node) .......... 695,880.0 X-Maximum (eastern-most node) .......... 707,110.0 X-Spacing (east/west node spacing) ..... 10.0 X-Nodes (east/west points) ............. 1,124 Y-Minimum (southern-most node) ......... 4,263,490.0 Y-Maximum (northern-most node) ......... 4,277,630.0 Y-Spacing (north/south node spacing) ... 10.0 Y-Nodes (north/south points) ........... 1,415 Node Statistics: Total Nodes ............................ 1,590,460 Minimum node value ..................... 411.08844 Maximum node value ..................... 906.4942 Minimum node value > 0 ................. 411.08844 Mean node value ........................ 632.860668 Standard deviation of node values ...... 97.145408 Non-zero nodes ......................... 1,512,046 Sum of all node values ................. 1,006,539,578.635214 Center of Mass (x,y) ................... 701,627.15038 4,270,620.274432 Null Values (z = -1.0e27) .............. 78414 <--- NEW |
(31) New Feature (05/12/05/JPR): The Geological-Utilities / Grid / Stats / Histogram program output now includes options for plotting the elevation (z or node values), the slope, the aspect, and the strike.
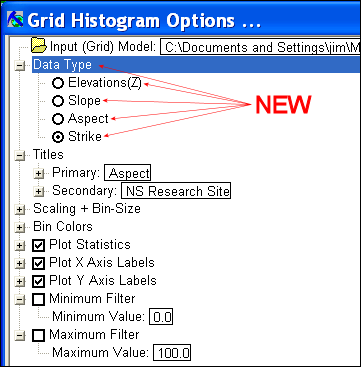
The "Elevation" type performs the same type of operation as the previous version. The slope, aspect, and strike options, however, employ a new strategy as shown within the following diagram;
| Slopes, aspects, and strikes are calculated by interpolating a point at the midpoint of each set of four nodes, using this point to construct four triangles, and then computing the orientations of the four triangles. |
 |
The various types of histograms are explained within the following table;
 |
Original grid model that was used for creating the histograms depicted below. |
 |
The elevation histogram shows the range and variability of elevations within a grid model. In this example, the average elevation is around 6,019. Elevations less than 5,980 and greater than 6,059 are uncommon. |
 |
The slope histogram shows the range and variability of slopes within a grid model. Slope angles are expressed in degrees, with zero being a flat surface and 90 being a vertical surface. In this example, the average slope is 5.4 degrees. Slopes greater than 11.2 are uncommon. |
 |
The aspect histogram shows the range and variability of dip-directions within a grid model. The "aspect" refers to the direction that a slope is facing. For example, an aspect of 90 would mean that the slope is east-facing. In this example, the average aspect is 154. The "background" (mean - 1 standard deviation to mean + 1 standard deviation) slope ranges from 77 degrees to 231 degrees. This means that most of the area is east, south, or west facing. Conversely, aspects greater than 300 (north-facing) are uncommon. |
 |
The strike histogram shows the range and variability of slope strikes within a grid model. This typically corresponds to the directions of ridges and valleys. In this example, there is a slight trend at zero degrees (North). |
(31) Cosmetic (05/12/05/JPR): The Geological-Utilities / Grid / Stats / Report program output now includes blocks of statistics for the slope, aspect, and strike of a given grid model. In addition, the output is now formatted into blocks that make it somewhat more readable.
| Grid Model Statistics --------------------- Grid Name ................................. C:\Documents and ... Dimensions: X-Minimum (western-most node) .......... 669,557.0 X-Maximum (eastern-most node) .......... 669,686.0 X-Spacing (east/west node spacing) ..... 1.0 X-Nodes (east/west points) ............. 130 Y-Minimum (southern-most node) ......... 4,374,076.0 Y-Maximum (northern-most node) ......... 4,374,235.0 Y-Spacing (north/south node spacing) ... 1.0 Y-Nodes (north/south points) ........... 160 Node Statistics: Total Nodes ............................ 20,800 Minimum node value ..................... 0.0 Maximum node value ..................... 0.981042 Minimum node value > 0 ................. 0.0 Mean node value ........................ 0.490526 Standard deviation of node values ...... 0.279913 Non-zero nodes ......................... 20,591 Sum of all node values ................. 10,202.939567 Center of Mass (x,y) ................... 669,625 4,374,151 Area/Volume: Cell Area .............................. 1.0 Map Area (X*Y) ......................... 20,511.0 Grid Area (Sum(Cell Area)).............. 20,800.0 Model Volume (Sum(Cell Area*Z)) ........ 10,202.939567 Non-Zero node area ..................... 20,591.0 Slope: Minimum ................................ 0.0 Maximum ................................ 9.1 Mean ................................... 2.2 Standard Deviation ..................... 1.7 Median ................................. 0.0 Skewness ............................... 1.18 Kurtosis ............................... 1.36 Aspect: Minimum ................................ 0.0 Maximum ................................ 360.0 Mean ................................... 183.8 Standard Deviation ..................... 106.2 Median ................................. 0.0 Skewness ............................... -0.06 Kurtosis ............................... -1.28 Strike: Minimum ................................ 0.0 Maximum ................................ 180.0 Mean ................................... 94.9 Standard Deviation ..................... 56.4 Median ................................. 0.0 Skewness ............................... -0.14 Kurtosis ............................... -1.24 |
The preceding example report tells us that the slope of the surface ranges between zero and 9.1 degrees with an average of 2.2 degrees (Note: Slope data for grid models that do not represent elevations is meaningless). The aspect data tells us that the average slope direction is 184 degrees. Finally, the strike data tells us that the average ridge and valley direction is 95 degrees with a standard deviation of 56, meaning that the surface is relatively random in terms of it's "fabric".
(30) Cosmetic (05/11/05/JPR): A new menu item titled "Directional Analyses" has been added to the Geological Utilities / Grid menu. The Slope/Aspect-Analysis and Directional-Maps options have been moved into this new sub-menu.

(29) New Feature (05/10/05/JPR): A new program titled "Time/Merge" has been added to the Geological-Utilities / Coords menu.
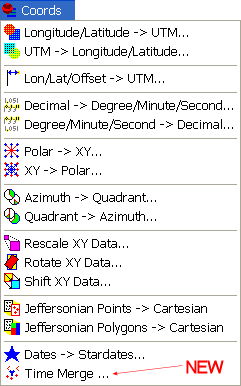
This program is used to add xy coordinates (e.g. UTM eastings & northings) to datasets that only have a "timestamp". The coordinates for a given event (e.g. a geophysical measurement) are established by locating the preceding and succeeding times within a designated GPS file (see item #27 below) and interpolating between these two "known" points.

Here's an example; Let's say that you have a dataset of conductivity measurements. Each measurement has a time. Now, let's say that you have another dataset from a GPS that has time and coordinates. This program will use the GPS dataset to add coordinates to the conductivity dataset so that the conductivity measurements can be subsequently mapped.


Conductivity Map
(28) New Feature (05/09/05/JPR): A new program titled "Geonics EM38" has been added to the File / Import / Geological-Utilities menu. This program is used to import the data from a Geonics EM38 conductivity meter into the RockWorks Geological Utilities datasheet.

This program will create a datasheet that contains the sampling time and the conductivity measurements.

(27) New Feature (05/08/05/JPR): A new program titled "Garmin Txt" has been added to the File / Import / Geological-Utilities menu. This program is used to import the data from Garmin MapSource "txt" files into the RockWorks Geological Utilities datasheet. In the process, the program will convert the longitude/latitude positions to UTM (Universal Transverse Mercator) coordinates.

Once selected, the program allows the user to determine if waypoints or tracks are to be imported into the datasheet.

If the "Waypoints" option is selected, the program will create a datasheet that contains the waypoint ID, description, easting (calculated), northing (calculated), elevation (from GPS), longitude (from GPS), and latitude (from GPS)data;

This data may then be plotted via the Geological-Utilities / Map / EZ-Map program;

If the "Tracks" option is selected, the program will create a datasheet that contains the GPS time, easting, northing, and elevation, as shown within the following example.

This data may be plotted via the Geological-Utilities / Map / EZ-Map program or used as the reference data for the Time/Merge program (see item #??).

(16-26) New Feature (05/07/05/JPR): The following programs have been redesigned to accommodate 22 additional coordinate conversion schemes including NAD-83 (commonly used by GPS units when exporting data in UTM coordinates). The previous versions of these programs were limited to NAD-27 (Clark 1866).
(26) Geological Utilities / Map / Adjust Coordinates / Longitude / Latitude -> Easting / Northing
(25) Geological Utilities / File / Import / Delorme GPL
(24) Geological Utilities / File / Import / NEIC
(23) Geological Utilities / Map / Land-Grid / Section Map
(22) Geological Utilities / Coords / Longitude / Latitude -> UTM
(21) Geological Utilities / Coords / UTM -> Longitude / Latitude
(20) Geological Utilities / Coords / Longitude/Latitude/Offset -> UTM
(19) Geological Utilities / Coords / Jeffersonian Points -> Cartesian
(18) Geological Utilities / Coords / Jeffersonian Polygons -> Cartesian
(17) RockPlot/2D / Utilities / Degrees -> UTM
(16) RockPlot/2D / Utilities / UTM -> Degrees
The "Central-Meridian" option within these programs have been renamed to "Zone". In addition, the progams now include an option titled "Automatic" that will automatically select a zone based on the longitude.
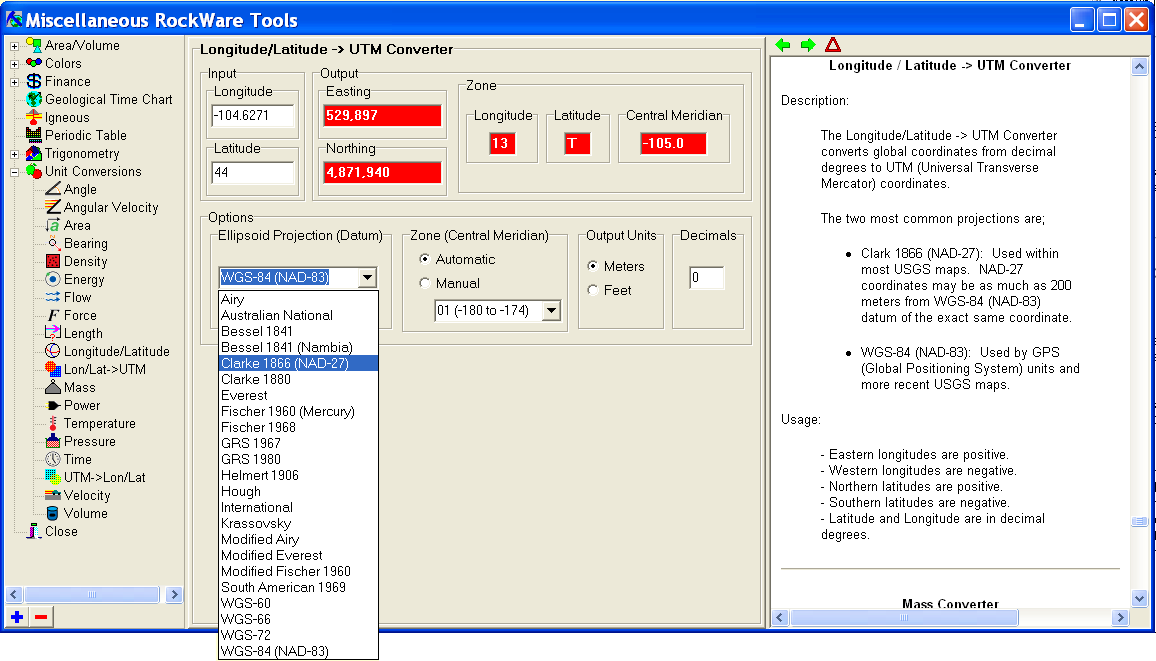
(15) New Feature (05/07/05/JPR): A new program called "UTM->Lon/Lat" has been added to the Geological-Utilities / Util / Conversions menu. This program converts UTM (Universal Transverse Mercator) coordinates into Longitude/Latitude positions using one of a variety of projections.

(14) New Feature (05/06/05/JPR): A new program called "Lon/Lat->UTM" has been added to the Geological-Utilities / Util / Conversions menu. This program converts a longitude/latitude position into UTM (Universal Transverse Mercator) coordinates using one of a variety of projections.
- Uploaded 4/15/05 -
(13) Bug Fix (04/14/05/JPR): The y-axis annotation within profiles no longer shows the z-value. This was a bug that was introduced within the previous version.
(12) Cosmetic (04/13/05/JPR): The Map Dimensions that are listed at the top of the Geological Utilities / EZ-Map program have been removed. They were redundant with the Map Dimensions that were listed within the Border sub-options. In addition, the main title for this group of options has been renamed to "Border Dimensions".

Similar modifications have been made to many other menus that shared the same redundancy.
(12) New Feature (04/13/05/MIW): Programs that use raster images are now able to import TIFF files with LZW compression.
(11) Bug Fix (04/12/05/JPR): The installation program no longer generates an "unable to copy descriptors" error message when copying files to a machine that has never had RockWorks installed on it. This bug was introduced in the previous release.
(10) Bug Fix (04/12/05/JPR): The Polyenhancement option within the gridding options has been fixed.

(9) Bug Fix (04/12/05/JPR): Changes that are made to the "Model Dimensions / Hardwire Project Dimensions / Adjust Project Dimensions" menu option (used within a variety of programs) are now reflected within the main Project Dimensions menu.
(8) New Feature (04/12/05/JPR): The contour labeling options that are used within a variety of programs now include options for automatically determining the number of decimals within the contour labels.

Automatic: Decimal places will be determined by evaluating the minimum and maximum control point values. Trailing zeroes will be automatically omitted.
Manual: Decimal places are manually defined by the user. Trailing zeroes will not be automatically omitted.

(7) Improvement (04/12/05/JPR): The project default dimensions are now based on a 50 x 50 grid rather than the average minimum distance between the control points.
(6) Improvement (04/10/05/JPR): The Borehole-Manager Lithology modeling algorithms now interpolate voxels within the entire model regardless of the offset caused by activating the Tilt or Warp options.

(5) Improvement (04/10/05/JPR): The Borehole-Manager I-Data modeling algorithms now interpolate voxels within the entire model regardless of the offset caused by activating the Tilt or Warp options.

(4) Bug Fix (04/06/05/JPR): The Borehole-Manager modeling algorithms (e.g. Lithology, I-Data, and P-Data) / Lithology / Model program no longer generates a fatal error if the "Tilt" or "Warp" options are activated. This was a bug that was introduced in the previous release.
(3) Improvement (04/02/05/JPR): The Geological-Utilities / Grid / Import / ASCII program will now ignore points that do not reside within the grid dimensions that are defined within the file header.
(2) Bug Fix (04/02/05/JPR): The Geological-Utilities / Grid / Import / ASCII program now works correctly. The previous version would generate an "Access Violation" error.
(1) Bug Fix (04/02/05/JPR): The RockPlot2D / Data / Append program now works correctly. The previous version would generate a message stating that it could not create the output file.