RockWorks/2004 Revision History
2004/Q4 (10/01/04-12/31/04)
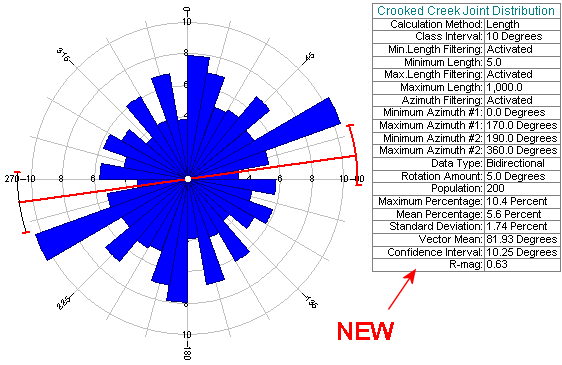
(90) New Feature (12/29/04/JPR): The Geological-Utilities / Linears / Rose-Diagram program now plots the diagram statistics within a formatted annotation box.
A boatload of new options have been added to the legend sub-menu that allow complete control of the legend box.

(90) New Feature (12/29/04/JPR): The Geological-Utilities / Planes / Stereonet program now plots the diagram statistics within a formatted annotation box.

Oodles of new options have been added to the legend sub-menu that allow complete control of the legend box.
(89) Removal (12/26/04/JPR): The program no longer reads 16-bit binary graphic files (i.e. diagrams produced before 07/08/98).
(88) New Feature (12/22/04/JPR): The user is now warned if an attempt is made to generate a "clipped" model in which the clipping surface does not have the same dimensions as the grids that are being clipped.
(87) New Feature (12/22/04/JPR): The Geological-Utilities / Map / Multivariate-Maps / Pie-Chart-Map program now includes options for plotting horizontal or vertical labels.


(86) Improvement (12/21/04/JPR): The Geological-Utilities / Map / Land-Grid / Lease-Map program now vertically centers the lease labels.

(85) New Feature (12/16/04/JPR): A new program called "Append" has been added to the Grafix / 2-D Utilities menu. This program is used to combine two-dimensional diagrams outside of the RockPlot/2D program. It also provides a means for combining diagrams within the RCL (RockWare Command Language).

(84) New Feature (12/16/04/JPR): The Geological-Utilities / Grid / Grids->Fence program now includes a block of options for plotting a reference "cage" around the diagram.

(83) New Feature (12/15/04/JPR): The Geological-Utilities / Grid / Grids->3D-Stack program now includes a block of options for plotting a reference "perimeter" around each grid layer.

The perimeter will be plotted as colored tubes. The user may control the color and radius (as a percentage of the project size).

These perimeters are especially useful if the portions of the grid will be rendered transparently (i.e. using the RockPlot/3D filtering options).

(82) New Feature (12/15/04/JPR): The Geological-Utilities / Grid / Grids->3D-Stack program now includes a block of options for plotting a reference "cage" around the diagram.
(81) Bug Fix (12/11/04/MIW): Bitmaps within striplogs are now properly clipped (assuming of course, that the clipping option has been activated).
(80) Bug Fix (12/10/04/MIW): The Geological-Utilities / Grid / Edit program no longer locks up with selected double-monitor computers.
(79) Bug Fix (12/10/04/MIW): The program now properly keeps track of multiple instances of the RockPlot/2D program (i.e. the proper index is now displayed within the main RockWorks Window menu.
(78) Bug Fix (12/10/04/MIW): The "Create Separate Location Map" option within the various Borehole Manager Section programs now works correctly. The previous version would produce a distorted map.
(75) Bug Fix (12/10/04/MIW): The Borehole-Manager / Stratigraphy / Fractures / Surface-Map program can now generate a 3-dimensional diagram. The previous version would only plot two-dimensional maps.
(74) Bug Fix (12/10/04/MIW): The Borehole-Manager / Fractures / Surface-Map program can now generate a 3-dimensional diagram. The previous version would only plot two-dimensional maps.

(73) Bug Fix (12/09/04/JPR): The GridList.atd sample file has been updated to reflect the renaming of the "Vadose Zone" to "Overburden".
(72) New Feature (12/08/04/JPR): The solid modeling menu now includes a new section titled "Maximum Distance Filter".

This new option is used to automatically assign a value to nodes that are more than a user-defined distance from a control point, regardless of the modeling algorithm.
Cutoff Distance: Nodes that are beyond this distance from a control point will be assign to the following value. Note: The cutoff distance is expressed as a percentage of the overall project size (i.e. the distance from the lower southwest corner to the upper northeast corner).
Replacement Value: Nodes that are beyond the cutoff distance from a control point will be set to this value.

Upper Left: Solid model without maximum distance filtering
(using inverse-distance anisotropic algorithm).
Note how anomaly extends beyond
region of control.
Lower Right: Solid model with 5% maximum distance filtering (using
inverse-distance anisotropic algorithm).
Note how anomaly is restricted to
region immediately surrounding control points.
(71) New Feature (12/08/04/JPR): The File / Import / Into Borehole Manager / Excel (XLS) program now includes an option for multiplying the depths by a user-defined conversion factor. This allows user to change units during the import (e.g. feet to meters or vice-versa).

(70) Improvement (12/07/04/JPR): The Borehole Manager / P-Data modeling is 25% faster than the previous version.
(69) Improvement (12/07/04/JPR): The Borehole Manager / I-Data modeling is 19% faster than the previous version.
(68) Bug Fix (12/07/04/JPR): The Borehole Manager / Stratigraphy / Structural Elevations / 2-Dimensional program will always plot a diagram regardless of the Geological Utilities / Map / Grid-Based Map / Create Diagram setting.
(67) New Feature (12/05/04/JPR): A new option titled "Show Filter Results" has been added to the following Borehole Manager menus that involve solid modeling.;
Lithology
I-Data
P-Data

This option will show the results of the range filtering, duplicate point filtering, and/or stratabound clipping before the model is generated.

(66) New Feature (12/05/04/JPR): A new option titled "Remove Duplicate Points" has been added to the following Borehole Manager menus that involve solid modeling.;
Lithology
I-Data
P-Data
This option will remove points that have already been defined (i.e. the same xyz coordinates).

(65) New Feature (12/04/04/JPR): The Geological-Utilities / Planes / StereoNet program can now be run via the RCL (RockWorks Command Language). The RCL command for this option is "STEREO".
(64) Improvements (12/03/04/JPR): The Geological-Utilities / Map / Multivariate-Maps / Starburst Map program now includes and option for selecting horizontal or radial labels.


(63) Improvements (12/03/04/JPR): The Geological-Utilities / Map / Multivariate-Maps / Spider Map program now includes and option for selecting horizontal or radial labels.


(63) Improvements (12/02/04/JPR): The Geological-Utilities / Linears / Rose program now includes a menu option for plotting radial or horizontal ray labels (the previous version was limited to radial labels).

This new capability is more comprehensible to non-technical audiences who have a difficult time reading non-horizontal text.

(62) Improvements (12/02/04/JPR): The following changes have been made to the Geological-Utilities / Linears / Rose program;
The Rays/Labels/Offset setting has been removed. The program now has enough "smarts" to figure out how to position a label if the font size is changed.
The ray label position is more precise.

(61) Bug Fix (12/02/04/JPR): The Borehole Manager / Striplogs / Multi-Log-3D / Clip option now properly clips the following entities;
Log Axes
Background Lines (I-Data & P-Data)
Special Patterns
Stratigraphy

Note: Raster images cannot be clipped.
(60) Bug Fix (12/02/04/JPR): The Borehole Manager / Striplogs / Multi-Log-Profile program now plots the special patterns and associated text correctly. The previous version would omit these items.
(59) Bug Fix (12/02/04/JPR): The Borehole Manager / Stratigraphy / Section / Straight / Plot-Logs option now works correctly. The previous version would incorrectly place the logs if the Plot-Logs option was turned on.
(58) Bug Fix (12/01/04/JPR): The Borehole Manager / Striplogs / Single-Log (2D) / Title / Manual-Offset option now works correctly. The previous version would ignore the manual offset setting.
(57) Bug Fix (11/30/04/MIW): The ReportWorks program no longer generates an error message if you delete a layer and then attempt to draw a new item.
(56) Bug Fix (11/28/04/JPR): Lithologic profiles and fence panels no longer generate an error message if there are undefined nodes within the model. This was a bug that was introduced in the previous release.
(55) New Feature (11/25/04/JPR): A new program called "Spider Map" has been added to the Geological-Utilities / Map / Multivariate Maps sub-menu.

This program is used to display special "spider" diagrams that depict the relative concentrations of up to nine mapped variables as polygons.

The Spider Map program menu is very similar to the other Multivariate Map options.

Diagram Radii: Maximum radius (as a percentage of the map size) of each sample symbol.
Scaling: Method used to define how variables are scaled.
Automatic: Automatically scale all variables such that the maximum value corresponds to the diagram radius. Note: When this setting is used, the "Maximum Value" settings within each component submenu is ignored.
Manual: This will use the "Maximum Value" settings with the individual component submenus to define the scaling.
Fill Polygons: File all polygons with a user-defined color.
Color: Color to be used when filling polygons.
Plot Polygon Perimeters: Plot a line around the border of the polygons.
Line Style: Line style, color, and thickness to be used when plotting a border around the polygons.
Plot Perimeter Circle: Plot background circle depicting the maximum radius.
Line Style: Circle perimeter line style, color, and thickness.
Fill Circle: Fill perimeter circle with a user-defined color.
Color: Color to be used when plotting the reference circle.
Plot Axes: Plot lines from the symbol origin to the maximum radius.
Axis Style: Line color, style, and thickness.
Plot Labels: Plot labels at the termination of each component axis.
Font: Axis label font, size, and color.
Offset: Distance from the maximum radius to the start of the axis label.
Border: Plot annotated border around the perimeter of the map.
Numerous settings identical to other programs that include a Border option.
Symbol Index: Plot an index to the symbol (e.g. component titles) along the right side of the map.
X-Offset: Horizontal (x) distance from the right edge of the map to the origin of the index symbol.
Y-Offset: Vertical (y) distance from the top of the map to the origin of the index symbol.

(54) New Feature (11/24/04/JPR): A new block of menu items titled "Explode" has been added to the Geological-Utilities / Grid / Grids -> Stratigraphic Model menu. If selected, the stratigraphic units will be separated by either a uniform vertical distance or variable distances as defined by a new "offset" column within the datasheet.

The "Uniform Spacing" option will vertical separate each stratigraphic unit by the distance specified within the associated "Separation Distance" setting as shown by the following example.

The "Variable Spacing" setting will separate each unit by the amount specified within the "Offset Column" of the datasheet. This new Offset Column and it's effects are illustrated within the following examples;


Note: The z-coordinates within the "Cage" option are not be applicable for exploded stratigraphy diagrams.
(53) Improvement (11/22/04/MMM): The following menu items now "trigger" help messages along the right side of the screen;
Borehole-Manager / I-Data / Statistics
Borehole-Manager / I-Data / Histogram
Borehole-Manager / P-Data / Statistics
Borehole-Manager / P-Data / Histogram
Geological-Utilities / Grid / Grid-Profile
Geological-Utilities / Grid / Grid-Fence
(52) Bug Fix (11/22/04/JPR): The "lithoblending" now works correctly with data sets that are comprised of very shallow boreholes separated by large distances (note how shallow the boreholes are within the example below). Specifically, the program now extends the lithologies to the extent of the project area.

(51) Bug Fix (11/22/04/JPR): The "Distance Filter" option within the Borehole-Manager / I-Data / Volumetrics program now works correctly. The previous version would zero the points within the search radius rather than outside of the search radius.
(50) Bug Fix (11/22/04/MIW): The RockPlot/3D IsoSurface now updates the Volume and the display after typing in an IsoLevel and removing focus from the edit box or hitting enter.
(49) Bug Fix (11/22/04/JPR): The Geological-Utilities column titles are no longer trashed after the Configure option has been selected.
(48) New Feature (11/19/04/JPR): The Geological-Utilities / Map / Starburst-Map program now includes an option for plotting a symbol index.

The offset units refer to the position for the center of the index symbol;
X-Offset: Horizontal (x) offset (in diagram-percentage units) relative to the eastern edge of the map.
Y-Offset: Vertical (y) offset (in diagram-percentage units) relative to the northern edge of the map.
This option is especially useful when plotting unlabeled symbols (i.e. maps that would be too cluttered with individual labels).

(47) New Feature (11/19/04/JPR): The Geological-Utilities / Map / Starburst-Map program now includes an option for plotting an annotated map border.


(46) New Feature (11/19/04/JPR): The Geological-Utilities / Map / Starburst-Map program now includes an option for specifying the amount of offset for the symbol annotation relative to the center of the symbol.

This new feature is useful for eliminating label overplots when working with symbols that contain many (e.g. 9) verbose labels.

(45) New Feature (11/19/04/JPR): The Geological-Utilities / Map / Starburst-Map program now includes an automatic scaling option that will scan the data and normalize the components to a user-specified diagram radius. This eliminates the need to specify individual scaling factors thereby making the program much easier to use.

Specifically, the user need only specify the input columns and the maximum radius. There's no longer any need to know the range of the data, the map dimensions, etc.

Map based on Surface_Geochemistry.atd sample file.
(44) Improvement (11/19/04/JPR): The Geological-Utilities / Map / Starburst-Map program will no longer labels a "petal" if the corresponding value for that petal is zero. This removes unnecessary and obnoxious labels from the symbol labels.

(43) Bug Fix (11/12/04/JPR): Patterns are no longer copied to the lithology or stratigraphy tables if the user selects the "Cancel" option from within the pattern-selection window.
(42) Bug Fix (11/12/04/JPR): The Stratigraphy / Section / Straight program now works correctly. The previous version would not work unless the user had first performed another operation that recompiled the logs.
(41) New Feature (11/09/04/JPR): New bitmaps have been added to the sample folder to illustrate the inclusion of bitmaps (raster images) within borehole diagrams. Accordingly, the contents of BH01, BH03, BH04, and BH06 have been changed in order to illustrate these capabilities;
|
Borehole # 1 Scanned E-log |
Borehole # 3 Core Photographs |
Borehole # 4 Photographs of Cuttings |
Borehole # 6 Photograph of Outcrop (Measured Section) |
 (Click here to enlarge.) |
 (Click here to enlarge.) |
 (Click here to enlarge.) |
|
| Sample File: bh_01_pic_01.png | Sample Files: bh_02....png | Sample Files: bh_04...png | Sample File: bh_06_outrcop.png |
(40) Bug Fix (11/09/04/JPR): The inclusion of bitmaps within striplogs now properly offsets the logs if a header and/or footer offset is specified within the bitmap table.
(39) Tip (11/04/04/JPR): If you're generating a very large model, or anything else that takes a long time, and you can't tell if the program is hung-up or not, open the \My Documents\RockWorks2004\System\RW2004_log.txt file with a text editor. The execution steps are listed within this file. Reload the file periodically to check on the progress of the operation.
(38) Improvement (11/04/04/JPR): The following changes have been made to the "lithoblending" modeling algorithm;
The interpolation of "outlier" nodes is now slightly faster.
The program will no longer interpolate points below the lowest defined layer. By "defined", we mean a layer that contains at least one control point.
The program will no longer interpolate points above the highest defined layer.

(37) Cosmetic (11/03/04/JPR): The menu settings for 3D fonts no longer include font angles because they were never used by any of the programs (i.e. RockPlot/3D can only plot horizontal text).
(36) New Feature (11/01/04/JPR): It is now possible to resample data within the I-Data and P-Data columns by right-clicking within the appropriate datasheet and selecting the Columns / Resample option.

Examples:
Two-dimensional bargraphs of resampled I-Data:

Three-dimensional bargraphs of resampled I-Data:

Two-dimensional bargraphs of resampled P-Data:

Three-dimensional bargraphs of resampled P-Data:

(35) Cosmetic (11/01/04/JPR): The diagram cartoons have been restored to the Geological-Utilities / Util / Geometry and Trigonometry menus.
(34) New Feature (10/30/04/JPR): It is now possible to specify the line thickness within graphic patterns.

This capability is especially useful for enhancing single-dot patterns (e.g. sandstone) that may not be otherwise visible on higher resolution devices (e.g. printers), as shown by the following example;

Compare Aquifer-1 and Aquitard-1 patterns within the two cross-sections.
Implications For Other Programs ("Ripple Effects"):
The Excel (XLS) import and export programs now expect and include the pattern line thickness within the appropriate sheets.
The ASCII import and export programs now expect and include the pattern line thicknesses..
(34) New Feature (10/31/04/JPR): The striplog bargraph menu has been significantly modified;

The "Fill Style" and "Shape" options have been relocated into separate 2D and 3D option menus to help eliminate some of the confusion between the different types of diagrams.
The 2D fill styles have been simplified into four categories while the pattern style has a new "white background" option (see diagram below)..
The 2D border line style may now be adjusted (see diagram below).
There is no longer a "None" option for the 3D fill style.

(32) New Feature (10/29/04/JPR): The lithoblending algorithm now ignores control points that are outside the region that is defined within the "Stratabound" filtering (assuming that the user has selected the "Ignore" option within the Stratabound filtering menus). The following example shows the results of separate stratabound filtering when combined with the new Tilt feature;

(31) Bug Fix (10/29/04/JPR): When an RCL script is launched as a Windows file association or from another program, the program now displays the proper column titles within the Geological Utilities datasheet. This bug did not effect RCL scripts that were launched from within RockWorks.
(30) Improvement (10/27/04/JPR): It is now possible to specify the color and the radius of the log axis within three-dimensional striplogs.

(29) New Feature (10/27/04/JPR): A new option titled "Tilted Modeling" has been added to the solid-modeling options. This feature will bias the lithologic modeling in a user-defined direction.

This new feature works like this;
The control point elevations are vertically shifted, based on the orientation of the user-defined plane.
The solid model is interpolated (based on the vertically shifted coordinates).
The corresponding nodes within the model are then shifted back to their proper elevations based on the corresponding elevations within the user-defined plane.
Why? Algorithms such as the horizontal lithoblending strongly bias the interpolation in a horizontal fashion. The "tilt" option introduces a regional gradient while still allowing the modeling to be horizontally biased.

(28) New Feature (10/26/04/JPR): A new option titled "Initialize" has been added to the The Geological-Utilities / Grid Menu.

This program can be used to create a new grid model that represents a flat plane with a user-defined elevation or a dipping plane based on a user defined orientation. If the plane is dipping, the user may define the xyz coordinates for a point that the dipping plane will intersect.

Menu Options:
Grid Name: Name of grid model to be created.
Model Dimensions: Click here to set the dimensions of the grid model.
Orientation: The new grid model may be either a horizontal or inclined plane.
Horizontal: Set all nodes such that grid represents a horizontal plane.
Elevation: Value to assign to all nodes within the grid model.
Inclined: Tilt the plane based on user-defined parameters.
Dip Direction: Dip direction, in degrees of the plane. 0 = North. 90 = East. 180 = West.
Dip Amount: Dip angle, in degrees, of the plane. 0 = horizontal, -90 straight down. 90 = straight up.
Reference Point: The output model will be adjusted such that the inclined plane intersects this point.
X: Easting at reference point.
Y: Northing at reference point.
Z: Elevation at reference point.
Map Dimensions: Click here to adjust dimensions of map.
Create Grid Diagram: Click here to plot a diagram depicting the new grid model.
The following example depicts various dip dip directions with a constant dip angle of -15 degrees.

Example: Let's say that a strike and dip on the surface was measured for an important fracture orientation. The xyz coordinates for this point would be used as the reference point for an inclined plane. By plotting this plane in conjunction with other data (e.g. a stratigraphic block model), the viewer can see where the plane should intersect other features (assuming, of course, that fractures are perfect planes - which they aren't).

To isolate the exact intersection of two grid models, simply subtract one from the other (via the Grid-Math routines). Node values that approximate zero within the resultant grid model show where the surfaces intersect. In the following example, the fracture plane surface (as generated by the new Grid / Initialize program) was subtracted from the Aquifer-1 (baby-blue in the diagram above) superface grid to create an intersection model. This grid was then converted to a boolean grid as shown within the following grid.

Region where surface fracture intersects Aquifer-1.
(27) Improvement (10/26/04/JPR): The Geological-Utilities / Util / Trigonometry / Apparent-Dip program now computes the proper apparent dip angle when the dip direction is greater than 90 degrees. The program now also uses the same dip angle convention as other programs within RockWorks (i.e. 0 = horizontal, -90 = straight down, 90 = straight up).
(26) Improvement (10/25/04/JPR): The Grafix / 3D-Utilities / Oriented-Object program has been extended as follows;
An optional "Length" column may now be included within the input file.

The oriented samples are now plotted as three-dimensional arrows rather than elongated cones.

The xyz location for the sample now corresponds to the start of the arrow rather than the midpoint.
A slew of new options have been added to the menu;

The new menu options are described as follows;
Length: The length of the arrow can be either constant, or variable, depending upon the "Length" column.
Fixed: All arrows will have the same length.
Length: Fixed length of arrows as a percentage of the overall project dimensions.
Variable: Arrow length will be defined by the Length column within the input file.
Multiplier: Lengths will be multiplied by this number to define the arrow length.
Color: Colors may be either fixed, defined by the Color column within the input file, or automatically computed by scanning the range of data within the Length column.
Fixed: All arrows will have the same color.
Color: Color to be used for all arrows.
Variable: Arrows will have different colors based on either the Color or the Length column within the input file.
Automatic: Automatically color the arrows by scanning the range of Lengths whereby low magnitudes are assigned a "cold" color (e.g. dark purple) and the high values are assigned a "hot" color (e.g. red).
Manual (Column-Based): Assign colors based on the Color column within the input file.
Tube Radius: Radius (expressed as a percentage of the project size) of the tube portion of an arrow.
Cone Radius: Radius (expressed as a percentage of the project size) of the cone tip that is plotted at the end of an arrow.
Cone Height: Distance (expressed as a percentage of the project size) from the base of the cone tip to the end of the arrow.
X-Offset: X-distance from the arrow start to the label start.
Y-Offset: Y-distance from the arrow start to the label start.
Z-Offset: Z-distance from the arrow start to the label start.
(25) Improvement (10/22/04/JPR): The File / Import / Into-Borehole-Manager / XLS program will now disable any imported boreholes that have bad or missing data for the borehole easting, northing, elevation , or total depth.
(24) Improvement (10/22/04/JPR): The File / Import / Into-Borehole-Manager / XLS program no longer requires that Excel sheets exist for all entities. For example, you don't necessarily need to have a Lithology sheet. The Location sheet, however, is the only required sheet.
(23) Improvement (10/22/04/JPR): The following changes have been made to the Project Dimensions menu;
A red text message will now appear below the block-model diagram indicating an error condition within any of the input parameters including undefined parameters and node spacings less than zero. The program no longer generates annoying and cryptic error messages as the user is trying to enter data.

If the menu dimensions are unresolved and the user attempts to switch to another mode (e.g. the Borehole Manager or the Geological Utilities), the program will present the user with a gentle reminder to fix the problem.

(22) Improvement (10/21/04/MIW): The vertical scale factor within the RockPlot/3D program no longer changes the aspect ratio of cones, tubes, oblates, and spheres. This means that diagrams look good even when they're vertically exaggerated.
(21) New Feature (10/21/04/JPR): A new option titled "Vectors" has been added to the Borehole Manager / Striplog menu.

This option will plot vectors (as defined within the new Vectors data group - see item #20 below) in three dimensions as shown within the following diagram that includes lithology and flow vectors.

Multi-log diagrams with vectors are used to depict within the following types of applications;
Hydrogeology: Groundwater flow directions.
Stratigraphy: Sedimentary structure orientations.
Paleomagnetism: Magnetic field directions.
Oceanography: Current directions and magnitudes.
Geotechnical: Ground movement (e.g. dam site deflection).

Menu Options;

Length: The length of the vector can be either constant, or variable, depending upon the "Magnitude" column within the Vectors data group.
Fixed: All vectors will have the same length.
Length: Fixed length of vectors as a percentage of the overall project dimensions.
Variable: Vector length will be defined by the Magnitude column within the Vectors data group.
Multiplier: Magnitudes will be multiplied by this number to define the vector length.
Color: Colors may be either fixed, defined by the Color column within the Vectors data group, or automatically computed by scanning the range of Magnitudes.
Fixed: All vectors will have the same color.
Color: Color to be used for all vectors.
Variable: Vectors will have different colors based on either the Color column within the Vectors data group or the Magnitude of the vector.
Automatic: Automatically color the vectors by scanning the range of Magnitudes whereby low magnitudes are assigned a "cold" color (e.g. dark purple) and the high values are assigned a "hot" color (e.g. red).
Manual (Column-Based): Assign colors based on the Color column within the Vectors data group.
Tube Radius: Radius (expressed as a percentage of the project size) of the tube portion of a vector arrow.
Cone Radius: Radius (expressed as a percentage of the project size) of the cone tip that is plotted at the end of a vector arrow.
Cone Height: Distance (expressed as a percentage of the project size) from the base of the cone tip to the end of the vector arrow.
(20) New Feature (10/21/04/JPR): A new data group titled "Vectors" has been added to the Borehole Manager.

This new data group allows the user to enter directional data such as groundwater flow directions, tiltmeter data, sonar data (current flow), etc. The data fields within the Vector group are defined as follows;
Depth: The downhole distance from the top of the hole to the vector origin.
Direction: Azimuth clockwise from North (0-degrees).
Inclination: 0 = horizontal, 90 = straight up, -90 = straight down.
Color: Color that will be used by when plotting vectors within 3D logs (see item #21).
Magnitude: Current flow rate or any other parameter that is used to define the "strength" of the vector.
(19) New Feature (10/20/04/JPR): A new option titled "Normal Distribution" has been added to the menu that is activated by right-clicking within a datasheet. This program is identical to the Geological-Utilities / Stats / Random / Normal-Distribution program except that it may now be used within selected Borehole Manager datasheets (see table within item #15).

(18) New Feature (10/20/04/JPR): A new option titled "Completely Random" has been added to the menu that is activated by right-clicking within a datasheet. This program is identical to the Geological-Utilities / Stats / Random / Completely-Random program except that it may now be used within selected Borehole Manager datasheets (see table within item #15).

(17) New Feature (10/20/04/JPR): A new option titled "Warp Model Based On Grid" has been added to the solid-modeling options.

This new feature works like this;
The control point elevations are vertically shifted, based on the corresponding elevations within the reference grid.
The solid model is interpolated (based on the vertically shifted coordinates).
The corresponding nodes within the model are then shifted back to their proper elevations based on the corresponding elevations within the reference grid.
Why? Algorithms such as the horizontal lithoblending strongly bias the interpolation in a horizontal fashion. The "warp" option introduces structure while still allowing the modeling to be horizontally biased.


Unwarped and warped I-Data models based on inverse-distance anisotropic
modeling.
- Thanks to Mike Brondos for another great idea. -
(16) Cosmetic (10/20/04/JPR): The following options have been moved from the main Edit menu to the new datasheet button menu (see item #110);
Cut-All
Copy-All
Columns
Rows
Digitize
Filter
Refresh
(15) New Feature (10/20/04/JPR): A new option titled "Datasheet Buttons" has been added to the General Preferences menu. If selected, a series of data-manipulation "speed buttons" will appear within the Geology Utilities datasheet as well as the individual datasheets within the Borehole Manager.

These buttons may be displayed as large buttons with labels, or small buttons without labels;

The configuration options include a list of selected buttons. This allows the user to define which buttons will be displayed at the top of the datasheet.

The "Menu..." button will display a list of additional options which were formerly located within the Edit menu;

This menu will also appear if the right mouse button is clicked within a given datasheet. This is especially useful if the datasheet button display has been disabled.
The following table shows which options are available for the various datasheets;
|
Geological Utilities |
Borehole Manager | |||||||||||
| Orientation | Lithology | Stratigraphy | I-Data | P-Data | Fractures | Water Levels | Symbols | Patterns | Bitmaps | Vectors | ||
| Columns | Yes | Yes | Yes | Yes | Yes | Yes | Yes | Yes | Yes | Yes | Yes | Yes |
| Insert | Yes | No | No | No | No | No | No | No | No | No | No | No |
| Delete | Yes | No | No | No | No | No | No | No | No | No | No | No |
| Math | Yes | Yes | Yes | Yes | Yes | Yes | Yes | Yes | Yes | Yes | Yes | Yes |
| Absolute | Yes | Yes | Yes | Yes | Yes | Yes | Yes | Yes | Yes | Yes | Yes | Yes |
| Column | Yes | Yes | Yes | Yes | Yes | Yes | Yes | Yes | Yes | Yes | Yes | Yes |
| Constant | Yes | Yes | Yes | Yes | Yes | Yes | Yes | Yes | Yes | Yes | Yes | Yes |
| Merge | Yes | Yes | Yes | Yes | Yes | Yes | Yes | Yes | Yes | Yes | Yes | Yes |
| Increment | Yes | Yes | Yes | Yes | Yes | Yes | Yes | Yes | Yes | Yes | Yes | Yes |
| Combine | Yes | No | No | No | No | No | No | No | No | No | No | No |
| Symbols | Yes | No | No | No | No | No | No | No | No | No | No | No |
| Lines | Yes | No | No | No | No | No | No | No | No | No | No | No |
| Statistics | Yes | Yes | Yes | Yes | Yes | Yes | Yes | Yes | Yes | Yes | Yes | Yes |
| Filter | Yes | Yes | Yes | Yes | Yes | Yes | Yes | Yes | Yes | Yes | Yes | Yes |
| Resample | No | Yes | Yes | Yes | Yes | Yes | Yes | Yes | Yes | Yes | Yes | Yes |
| Depths | No | Yes | No | No | No | Yes | Yes | No | Yes | No | No | Yes |
| Intervals | No | No | Yes | Yes | Yes | No | No | Yes | No | Yes | Yes | No |
| Fix | Yes | Yes | Yes | Yes | Yes | Yes | Yes | Yes | Yes | Yes | Yes | Yes |
| Rows | Yes | Yes | Yes | Yes | Yes | Yes | Yes | Yes | Yes | Yes | Yes | Yes |
| Insert | Yes | Yes | Yes | Yes | Yes | Yes | Yes | Yes | Yes | Yes | Yes | Yes |
| Delete | Yes | Yes | Yes | Yes | Yes | Yes | Yes | Yes | Yes | Yes | Yes | Yes |
| Go To | Yes | Yes | Yes | Yes | Yes | Yes | Yes | Yes | Yes | Yes | Yes | Yes |
| First | Yes | Yes | Yes | Yes | Yes | Yes | Yes | Yes | Yes | Yes | Yes | Yes |
| Last | Yes | Yes | Yes | Yes | Yes | Yes | Yes | Yes | Yes | Yes | Yes | Yes |
| Specific | Yes | Yes | Yes | Yes | Yes | Yes | Yes | Yes | Yes | Yes | Yes | Yes |
| &nb | ||||||||||||

