

RockWorks: Major Updates to Contouring, Fault Modeling, and More
The latest release of RockWorks introduces significant enhancements to contouring and fault modeling, expanding the power and flexibility of its modeling and visualization tools. This release also includes a wide range of new features, performance improvements, and usability enhancements.
Read more below and explore the complete list of updates in the RockWorks Revisions List.
Contour Setting Consolidation: In RockWorks 2026, the Contour Line and Colorfill menu settings have been consolidated. The same settings now apply to both 2D and 3D grid-based diagrams. As a result, 2D and 3D diagrams created from the same menu can no longer use separate colorfill or contour settings.
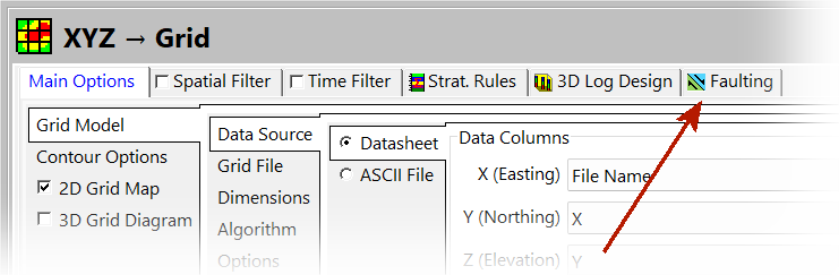
Fault Setting Tab Added: Options for incorporating faults into grids, solid models, and 2D/3D diagrams have been consolidated into a single Faulting tab. This tab is now available at the top of applicable RockWorks menus, making fault-related settings easier to find and manage.
The ribbon menu as the top of the Lithology, Stratigraphy, and Hydrostratigraphy “Pickers” has been condensed to accommodate smaller monitors.
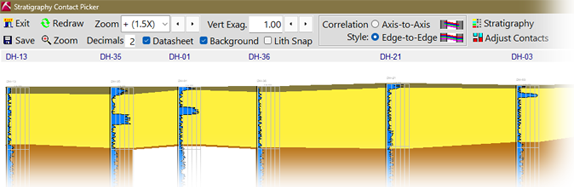
Improved Geologic Pickers – Lithology, Stratigraphy, and HydroStratigraphy Pickers now support background sections and transparent correlation panels.
Creating a new project or changing the project now clears the main datasheet only if the project folder actually changed. If the datasheet has not been saved, the user will be given an opportunity to save it!
When closing the program, the “Save Warning” now has an option titled “No to All” that will skip subsequent save warnings and discard any unsaved changes to RockPlot2D and RockPlot3D files.
Expanded and updated Coordinate Conversion support for newer coordinate systems and easier access to user-defined EPSG and ESRI definitions.
The following changes have been made to the RockPlot2D | Edit | Copy Image and RockPlot3D | Edit | Copy Image operations.
- The “Copying Image to Clipboard” options within the RockPlot2D | Options menu have been relocated into the main RockWorks | Setup | Preferences | RockPlot sub-menu
- The RockPlot3D | Edit | Copy Image tool now behaves in a fashion identical to the 2D version as determined by the Settings | Preferences | RockPlot sub-menu.
- The copy-to-clipboard process is now instantaneous.
Program Automation
The RockWorks Playlist offers easy automation – just click a button to add a program to the current Playlist. Then, click a button to run your Playlist to create models, maps, diagrams while you have lunch. Available for Basic (5 items), Standard (5 items) and Advanced (unlimited items).
The Playlist provides:
- Turn-key tools for colleagues or clients who need to use RockWorks capabilities without any downtime spent learning how to use it.
- A memory aid for projects that are infrequently re-visited.• An audit trail to serve as a record of what was done and all of the associated menu settings.
- Automation of data processing in which new data is being introduced on an ongoing basis (e.g. resampling and monitoring).
- A template for processing different data sets/sites using a streamlined workflow.
Recent Playlist Improvements:
- Launch an external program from within the Playlist to automate data transfer.
- Load dimensions from a sub-site within the project, and from a saved coordinate list.
- Easier navigation with multi-select cut/copy/paste.

- Playlist Button: Add the current application to the Playlist.
- Favorites Button: Add the current application to your Favorites List.
- Output Options: Export diagrams and reports directly to the desired output format.

RockWorks Command Scripting for Advanced users – start with a Playlist and go for it!

Interface Features
- Search option lists the programs that contain your search terms.
- Favorites Option: Create your own menu list of frequently-used programs


- Borehole Manager Tab: New features including database comparisons.
- Playlist Tab: Automate multiple tasks in an interactive fashion.
- Faults Tab: Redesigned to manage all faults in 3D as a database.


- Dock/Undock: Arrange main RockWorks program tabs in any configuration.
- Full-Expand Option: Stretch the main RockWorks menu across multiple screens.

- Expanded Project Dimensions Summary: View more information at a glance.
- Update Project Dimensions using a rectangle drawn on a map.
- New Layout Options: Save and retrieve up to 5 different main menu layout configurations.

- Execution History Tab: Review program history to diagnose problems.
- Videos Tab: Access the entire library of RockWorks instructional videos.
- Application Descriptions: Read program abstracts as you move your cursor over items within the pull-down menus.


- Consolidated Application Menu Ribbon: No more switching between program tabs.

Application Windows
- Nested Tab Menus: Replace hard-to-read expanding/collapsing menu trees.
- Expanded Spatial Filtering: Moved to the top of the menu and now applied to most applications.
- Expanded Time Filtering: Moved to the top of the menu and now applied to most applications.
- Instructions Checkbox: Enable/disable help messages.
- Restore defaults: Restore default settings for individual menus.


Programs that read data from the Datasheet now include an Example button, which will list one or more sample files that can be used to demonstrate the application.

Diagram Embellishments
To eliminate additional steps in combining and appending diagrams, common embellishments have been added to the programs that create sections, profiles, projected sections, maps, 3D diagrams and charts.
- Sections, Profiles & Projected Sections – Additional diagram layers include perimeter annotation, surface profiles, faults, infrastructure, up to five 2D graphics overlays, peripheral annotation (titles, title blocks, legends, and image), and a border.

- Maps – Additional map layers include a background image, labeled axes, map overlays, up to five additional 2D diagrams, peripheral annotation (titles, title blocks, legends, scalebar, and image), and a border.
- 3D Diagrams – Additional 3D layers include striplogs, draped images, floating images, control point spheres, a perimeter cage, legends, 3D infrastructure, 3D faults, and up to five additional 3D diagrams.


Expanded Output Options
2D, 3D, Google Earth, and Reporting programs now include output and export options that remove post-processing steps and facilitate uninterrupted Playlist scripting.
- All programs that generate 2D diagrams now include options for simultaneously exporting the output to PDF (as raster images) and/or PNG.
- New 3D output tab includes options for exporting the diagram to a PNG image using a variety of user-specified viewing parameters.
- New Google Earth output tab includes options for specifying the initial viewer location and viewing direction.
- Programs that create reports now provide options for direct output to CSV (Excel), Txt (Notepad) or RTF (Word).
- Striplogs – PDF Bulk Exporter – All of the boreholes within a database can now be exported in one step to a multi-page PDF (as raster images) file that can serve as a report appendix.
Other Database Features
New database comparison tool provides a quick and easy report of the differences between borehole data in different projects. This capability is especially useful when the same database has “diverged” (e.g. multiple users working on the same database without a shared version on a network server).
RockWorks now supports over 5,800 coordinate systems. Convert coordinates in the datasheet, database, maps, and data as it’s being imported.
Import multiple raster logs into the Borehole Manager at one time.
Modeling Features
- Time-Based Modeling – New T-Data Multiple Solids program automatically creates “snapshot” models at designated time intervals which can be constrained by a permeability model and output to a variety of animation programs. Refer to the TCE Site sample project and tutorial.

- New Automatic Polygon Clipping – All gridding and solid modeling programs now include an option for clipping the model based on an automatically-defined convex polygon defined by the control points, analogous to stretching a rubber band around the boreholes.
- Clip Grid Models using polygons in a table or a map.
- New Spatial Filtering – All programs that involve coordinates now include a spatial filtering option so that subsets (including zones between surfaces) can be selectively analyzed/modeled.
- New Time-based filtering options have been added to the Hydrochemical utilities (i.e. Durov Diagrams, Piper Diagrams, Stiff Diagrams and Stiff Maps) as well as any programs that might include striplogs (in order to filter water levels and/or T-Data).
- Create a depth to target grid model for specified values in a solid model.
- Calculate where two grids intersect, such as a water table and surface topography.
- Import 5 meter DEMs to a RockWorks grid model.
- Create a solid model in which the voxel values between two surface model grids are defined by another grid (e.g. ore grades).
Animations
New animation tools have been added for creating videos in which XYZ data, grids, and solids are transitionally “morphed” to show geochemical migrations over time. The output can be saved to AVI, Animated GIF, MP4, WMV, individual frames or exported as a Google Earth animation.
- Solid model reveal animations offer starting view, zoom, stretch, colors, and more. Include up to 12 different changes of direction.
- Solid isosurface animations offer 6 cutoff levels for finer detail.
- Automatically hide time-data striplogs with no data for the sampling date.
- Processing speed has been improved by 30%
Other Map and Diagram Features
- Borehole Location Maps – Display maps symbols from the database, or used fixed symbols.
- 3D Cylinders – Specify the number of sides in 3D cylindrical entities (such as logs) for faster display and smaller export.
- Display multiple surface profile polylines (such as ground surface AND water table) in cross sections.
Reporting Features
- Create a report that lists the change in mass of a contaminant over time, from a list of time-specific geochemical solid models.
- Restrict graphs and reports for subsurface quantitative data based on lithology types or stratigraphic units.
- Output a list of files/entries in the Project Manager.
- New report formatting and export options.