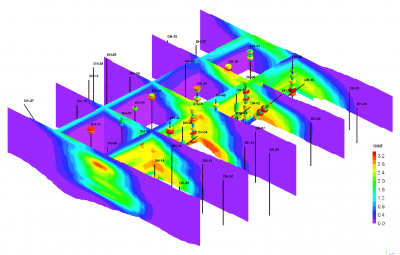
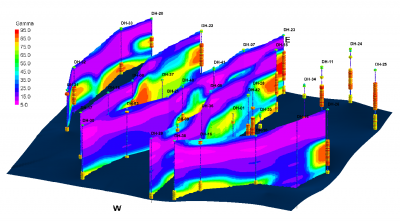
Create three-dimensional slices through surface-based and block models of interpolated data: lithology, stratigraphy, geochemical/geophysical data, fractures, aquifers, colors, and vectors. Include logs, coordinate labels, titles.
These features are included in RockWorks Standard and Advanced levels.
General Fence Diagram Features
- Define fence panel locations from preset configurations, draw your own, and/or import a list of panel endpoints
- Include 3D logs
- Include axis coordinate labels, titles
- Include lithology, stratigraphy and color legends
- Plot ground surface profile
- Turn panels on and off
Lithology Fences
Display your interpolated lithology in fence panels. Include a lithology color legend and view volumes of the lithology types in the 3D window.
Stratigraphy Fences
Display interpolated stratigraphic surfaces in fence panels. Include a stratigraphy color legend. Turn individual layers on and off. Stratigraphic fences can be created in Shapefile format for display in ArcScene®
Geochemistry Fences
Interpolate a solid model of “I-data” or time-based “T-Data” measurements, create 3D slices through the model with line and/or color-filled contours. Include color legends, display in combination with an isosurface, and/or append stratigraphic surfaces for reference.
Geophysical, Geotechnical Fences
Interpolate a solid model of “P-data” measurements, create 3D vertical fence panels with line and/or color-filled contours.
Color Fences
Interpolate a solid model of soil colors, create a 3D diagram with vertical fence panels showing soil color fills. Display in combination with other models, stratigraphic and aquifer layers, etc.
Fracture Fences
Model fracture locations in 3D and display slices of the model as fence panels. Append fracture discs on 3D logs, and include a legend to colors and distances.


