Create single- and multi-panel 2D cross sections of interpolated (modeled) geologic data: lithology, stratigraphy, geochemical/geophysical data, fractures, aquifers, colors, and vectors. Include logs, borders, titles, legends, location maps.
These features are included in RockWorks Standard and Advanced Levels.
General Cross Section Features
- Slice through models as single-panel profiles with projected logs
- Slice through models as multi-panel cross sections with vertical logs
- Slice through models as multi-panel projected sections with vertical logs
- Plot vertical axis labels (elevation)
- Plot horizontal axis labels (distance or x, y coordinates)
- Plot title and end point labels (e. g. A and A’)
- Plot ground surface profile
- Overlay strip logs
- Include lithology, stratigraphy and color legends
- Create section location maps as separate images and/or included in the section itself.
- Profile diagrams can display orientation “stripmaps” and borehole collar distances to the projected profile line.

Lithology Sections
Interpolate a solid model of lithology materials, create 2D profiles, sections, and projected sections with colors and/or lithologic patterns.

Stratigraphy Sections
Interpolate a surface-based model of stratigraphy layers, create 2D profiles, sections, and projected sections with formation colors and/or pattern designs.
(See also simple stratigraphic cross sections.)

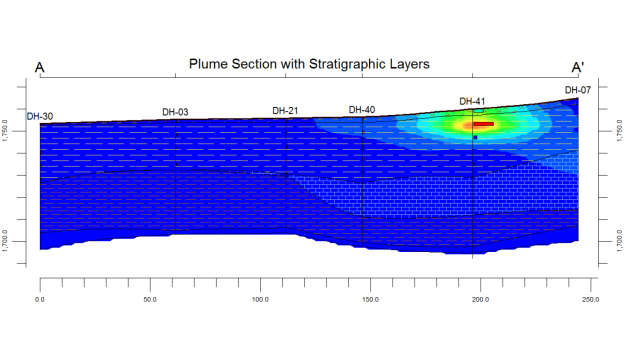
Geochemistry Sections
Interpolate a solid model of “I-data” or time-based “T-Data” measurements, create 2D profile, section, and projected section diagrams with line and/or color-filled contours.

Geophysical, Geotechnical Sections
Interpolate a solid model of “P-data” measurements, create 2D profile, section, or projected section diagrams with line and/or color-filled contours.

Color Sections
Interpolate a solid model of soil colors, create 2D profiles, sections, and projected sections with soil color fills.

Fracture Sections
Display proximity to fractures as single- and multi-panel cross sections. Include line and/or color-filled contours on the panels.
Aquifer Sections
Aquifer top and base surfaces can be displayed in profile, section, and projected section diagrams, with color and/or pattern fills.
