Description
Oriana for Windows calculates the special forms of sample and inter-sample statistics required for circular data. It also graphs your data in a variety of ways, allowing you to easily demonstrate patterns. These analyses and graphs are rarely found in other statistical packages.
Analyses
Oriana calculates a variety of single sample statistics as well as inter-sample comparisons. The basic statistics include the circular mean, length of the mean vector, circular standard deviation and 95% and 99% confidence limits. There are also a number of single sample distribution tests, such as Rayleigh’s test of uniformity and Rao’s spacing test. Samples can be compared with various tests such as Watson-Williams test or Mardia-Watson-Wheeler test. Intersample correlations can also be calculated. A full list of analyses can be found here.
The results of the analyses are presented in a tabular format, ready for pasting directly into your word processor for a report or manuscript.
The number of variables and cases that Oriana can analyze is only limited by the amount of installed memory and disk space (up to 2 billion maximum).

Graphics
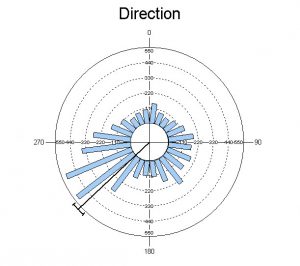
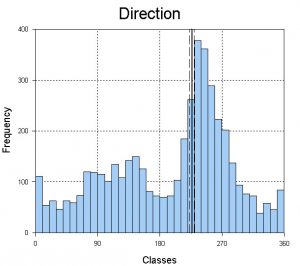
A variety of graph types are available in Oriana. The data for each set of observations can be summarized with rose diagrams or circular histograms. The rose diagram/histogram bars can be stacked to show the relative proportions of subsets within the data. Linear histograms can also be plotted.
Linear data can be incorporated into two variable rose diagrams or histograms as well as in vector plots, where an arrow or bar is drawn for each case, with the length representing the linear data, and circular scatterplots.
Individual observations can be shown in raw data plots. Distribution plots allow you to assess whether the data depart from a uniform or von Mises distribution. The distributions of two sets of observations can also be compared with Q-Q plots, and regular scattergrams can also be produced.
Various aspects of the appearance of the graph can be modified, including fonts, colors of lines, objects and background, and text of titles and axis labels. When the graphs are ready you can print them to any Windows printer, save to various graphic formats, or copy and paste them to any other Windows application.
Full details of the graphics capabilities can be found here.


Oriana Analyses
Oriana calculates a variety of single sample statistics as well as inter-sample comparisons.
Oriana User Interface
Oriana uses the KCS desktop metaphor. You can spread out your data, the statistical results and several graphs in front of you while you study them, just like paper on your desktop. Try new graphs, add new data, peruse the results, then print or save

Please complete this short form before your download. We will send you a courtesy email should you need to contact us with download or installation questions.
- Microsoft Windows 98SE/Windows NT 4 or later (including Windows ME/2000/XP/2003/Vista/7/8/10)
- 512Mb RAM memory
- 12Mb disk space
Oriana is delivered electronically. Please allow up to 24 business hours to receive download instructions.
Related products
-
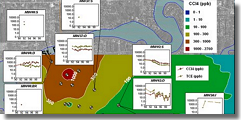
Environmental data managementAdd to cart -
Flow, Transport, and Heat Modeling Program$2,750.00 – $4,125.00 Add to cart -
Stereonets & rose diagrams$149.00 – $299.00 Add to cart -
CAD to Shapefile converter$149.00 – $990.00 Add to cart -
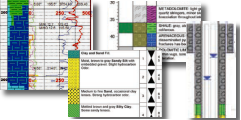
Striplog, borehole log plotting$370.00 – $1,925.00 Add to cart -
Contouring & variogram reference$35.00 Add to cart -
Geological Modeling Software$1,650.00 – $5,500.00 Add to cart -
Shapefile to CAD converter$149.00 – $950.00 Add to cart -
Geologic Tools & Utilities$399.00 Add to cart -
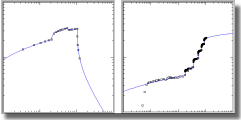
Aquifer Test Software$500.00 – $1,000.00 Add to cart